ChartingCompare


Likes 0
Link | Rickshaw | DyGraph | Plotly | C3.js | FusionCharts | Highcharts |
|---|---|---|---|---|---|---|
| Last update | Nov. 17th 2020 12:01:38 AM | Nov. 16th 2020 11:51:48 PM | Nov. 16th 2020 11:51:48 PM | Jun. 14th 2017 2:40:23 PM | Dec. 2nd 2020 10:11:16 AM | Dec. 2nd 2020 10:11:15 AM |
| Website | shutterstock.com/... | dygraphs.com | plotly.com/... | c3js.org | fusioncharts.com | highcharts.com/... |
| Image | 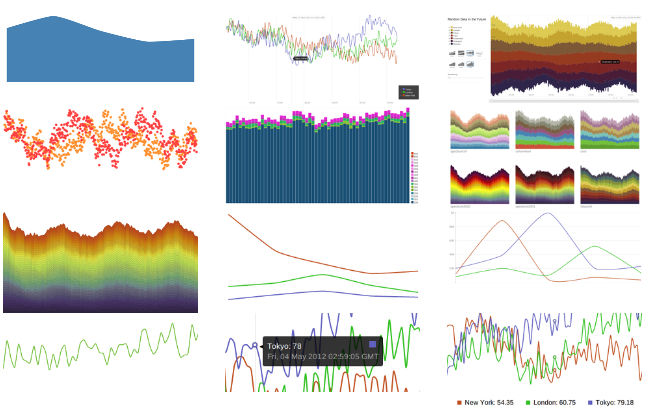 |  | 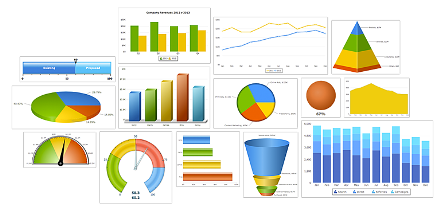 |  | ||
| Latest version | 2012 | 1.0.1 | 1.0 | 0.3 | 3.4 | 1.0 |
| Open source | Yes | Yes | - | Yes MIT | No | Yes CC by-nc 3.0 |
| Internet Explorer | - IE 9, IE8 requires Aight | Yes IE < 9 with Google's excanvas | Yes IE 8 + | Yes | Yes | Yes 6.0+ |
| Firefox | Yes | Yes | Yes | Yes | Yes | Yes |
| Safari | Yes | Yes | Yes | Yes | Yes | |
| Google Chrome | Yes | Yes | Yes | Yes | Yes | Yes |
| iPhone | Yes | Yes | Yes | Yes | Yes | |
| iPad | Yes | Yes | Yes | Yes | Yes | |
| Export files | Yes From cloud version | Yes | Yes | |||
| Demo web link | shutterstock.com/... | plotly.com/... | c3js.org/... | fusioncharts.com/... | highcharts.com/... | |
| Trial and Prices | Free of charge with copyright attribution | MIT-Like | Basic charts are free. $249/developer/year for advanced charts, $995/developer/year for 3d charts | Free | 999 | Free for non commercial use and testing $ 90 (single website) - $ 3600 (10 developers license with maintenance and support for 12 months) |
| Ability to zoom in and out of charts | Yes | Yes | Yes | Yes | Yes | Yes |
| Combination of charts | No | Yes | Yes | Yes | Yes | |
| Clickable points | Yes | Yes | ||||
| Data labels | Yes | Yes | Yes | Yes | Yes | |
| Dot | Yes | No | ||||
| Interactive charts | Yes | Yes | Yes | |||
| Annotations on the chart | No | Yes | Yes | Yes | ||
| Highlights region | Yes | No | ||||
| Minified size | 133 k | 186 kb | 126 kb | 553 KB | 45 kb | |
| Sparklines | No | Yes | Yes | Yes | Yes | |
| Dependencies | d3.js | excanvas if ie < 9 | D3.js | None | None | |
| Graphic technology | SVG | canvas | D3.js and stackgl | SVG | SVG / VML | HTML5 Canvas / SVG / VML |
| Donut | No | No | Yes | Yes | Yes | |
| Node / Edge graph | No | Yes | Yes | Yes | ||
| Axes multiples "multivalués" | Yes | |||||
| Bubble | No | No | Yes | Yes | Yes | Yes |
| Interactive (responds to mouse hover/click) | Yes turned off by default | Yes | Yes | Yes | Yes | |
| Documentation | Good | Excellent | ||||
| Source code repository | None | GitHub | ||||
| Other charts | histograms, box plots, time series, subplots, polar charts, multiple axes, insets, log plots, maps, contour plots, 2D histograms, error bars, 3D surface plots, 3D scatter plots, 3D line plots | Column, Funnel, Pyramid, Waterfall, Marimekko, Gauges, Gantt Charts, Heat Map, Radar, Box and Whisker, Kagi, Step Line | ||||
| Source code repository | github.com/... | github.com/... | github.com/... |


User reviews and comments
Many bugs, not reliable, and expensive. Actualy relies on Raphael ... so use Raphael direclty !