ben important


J'aime 0
Lien | Line | Axe date-temps | Scatter | Export de fichiers | Possibilité de zoomer + ou - sur les graphiques | Combinaison de graphiques | Annotations sur le graphique | Gamme de prix | Open source | Graphic technology | J'aime | Image | Other charts | Site web | Libellés des données | Graphiques dynamiques | Interactive (responds to mouse hover/click) |
|---|---|---|---|---|---|---|---|---|---|---|---|---|---|---|---|---|---|
| amCharts | Oui | Oui | Oui | Oui PNG, JPG, SVG, PDF | Oui | Oui | Oui | 1400 - Saas | Non | SVG or VML for old IE | J'aime 3 | 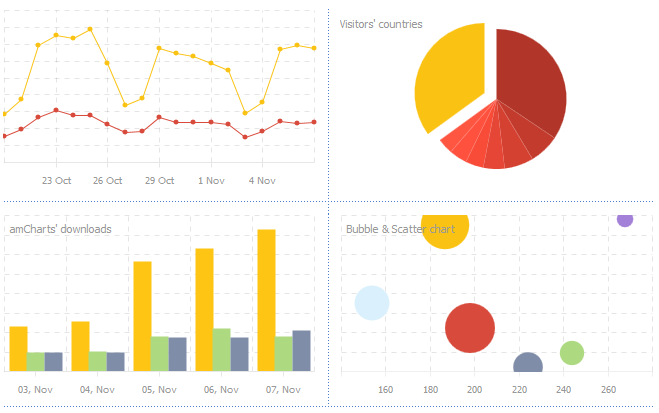 | Gauges, Radar, Polar, Step line, Step without Risers, OHLC, area range, Donut, Funnel, Waterfall, Bullet, XY, Maps are available as additional package | amcharts.com | Oui | Oui | Oui |
| AnyChart | Oui | Oui | Oui | Oui PNG, JPG, SVG, PDF | Oui | Oui | Oui | Education / Non-profit licensing - free. Commercial licenses start from $49: anychart.com/... | Oui | SVG or VML for old IE | J'aime 27 |  | Gauges, Radar, Polar, Stepline, Step, OHLC, Range Area, Range Bar, Funnel, Pyramid, Maps, Gantt, Stock, Bullet, Box, Error, Radar, Polar, and more | anychart.com | Oui | Oui | Oui |
| arcadiaCharts | Oui | Oui | Must link back to site. No license available | Non | Canvas | J'aime 0 |  | Oui | Oui | ||||||||
| CanvasJS Charts | Oui | Oui | Oui | Oui | Oui | Oui | Oui Indexlabels | 999 - Saas | Oui CC nc 3.0 | HTML5 Canvas | J'aime 4 | 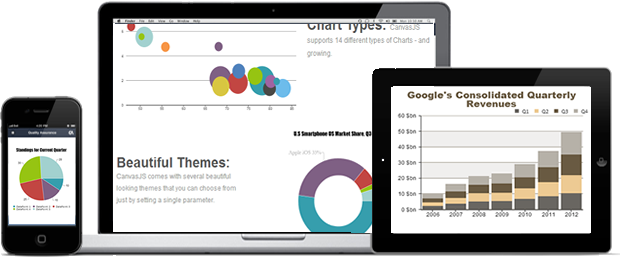 | Spline, Step Line, OHLC, Scatter, Funnel, Pyramid, Step Area, Stacked Area, Stacked Area 100%, Range Area, Range Spline Area, Stacked Column, Stacked Column 100%, Range Column, Stacked Bar, Stacked Bar 100%, Range Bar | canvasjs.com | Oui | Oui | Oui |
| D3.js | Oui | Oui | Oui | Oui | Oui | Oui | Non | Free under BSD | Oui BSD License | SVG | J'aime 16 |  | D3.js is a drawing library, and not just a chart library. You can make virtually any visualization or graph given time. | d3js.org | Oui | Oui | Oui |
| DEX | Seems to be free | Oui | J'aime 0 | ||||||||||||||
| dhtmlxChart | Oui | Oui | Oui | Oui export to PDF/PNG | Non | Oui | Oui | Gratuit avec license GNU GPL $49 | Oui GNU GPL | Canvas | J'aime 3 |  | calendar heatmap, treemap, radar | dhtmlx.com/... | Oui | Oui | Oui |
| Dojo (dojox/charting) | Oui | - Feasible with custom code | Oui | Oui SVG | Oui | Oui | Non | Free | Oui BSD, AFLv2 | SVG, Canvas if not available VML or Silverlight | J'aime 1 |  | Bubble, Candlestick (OHLC), Spider. Other Dojo modules provide as well TreeMap, Gauges etc... | dojotoolkit.org/... | - Only on a subet of charts, improvement planned for future versions | Oui | Oui |
| DyGraph | Oui | Oui | Non | Oui | Non | Non | MIT-Like | Oui | canvas | J'aime 1 | dygraphs.com | Oui | |||||
| Ejschart | Oui | Oui | Oui | - | Oui | Oui | Oui | $1000 | Non | Canvas / SVG / VML | J'aime 1 |  | f(x), Gauge, Donut, alarm, candle stick, step series, over under, open high low, error series, stacked bar, trend, and floating bar | ejschart.com | Oui | Oui | Oui |
| Elycharts | Oui | Non | Non | Non | Non | Non | Non | Gratuit | Oui MIT License | SVG | J'aime 2 | 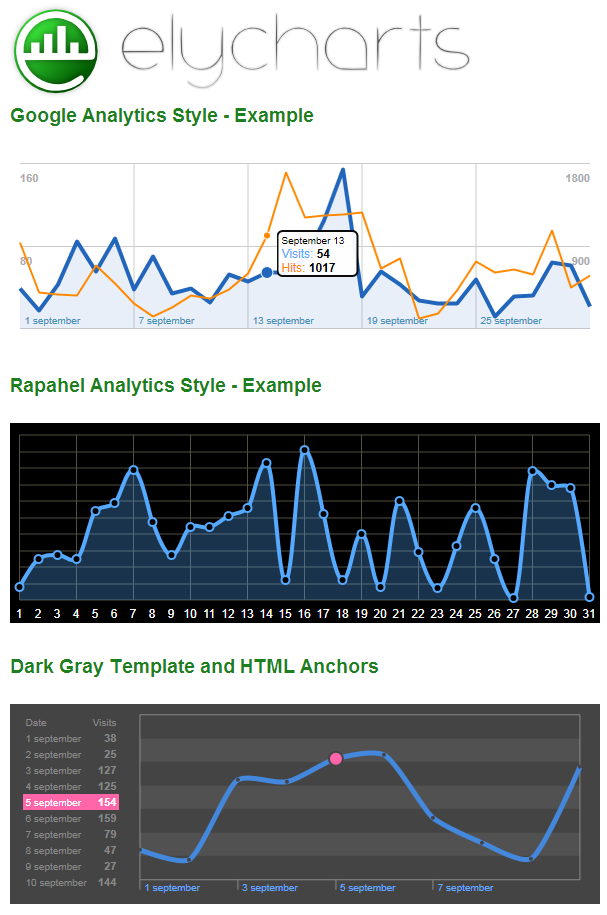 | Funnel | elycharts.com | Oui | Oui | Oui |
| Flot | Oui | Oui | Non | Oui | Oui | Oui | Gratuit | Oui MIT License | J'aime 9 | 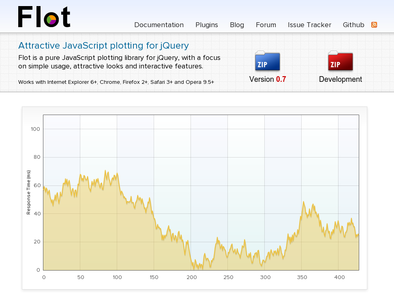 | google.com/... | Oui | Oui | ||||
| flotr2 | Oui | Oui | Oui | Oui PNG, JPG | Oui | Oui | Oui | Free | Oui MIT License | Canvas | J'aime 0 |  | Bubble, radar | humblesoftware.com/... | Oui | Oui | |
| FusionCharts | Oui | Oui | Oui | Oui | Oui | Oui | Oui | 999 | Non | SVG / VML | J'aime 6 |  | Column, Funnel, Pyramid, Waterfall, Marimekko, Gauges, Gantt Charts, Heat Map, Radar, Box and Whisker, Kagi, Step Line | fusioncharts.com | Oui | Oui | Oui |
| Google Chart Tools | Oui | Oui | Oui | Non | Non | Oui | Oui new Annotation charts available in 2015 | Free | Non | SVG | J'aime 2 | Geo chart, table, gauge, tree map | google.com/... | Non | Non | Oui | |
| gRaphaël | Oui (4 Kb) | Non | Non | Non | Non | Non | Non | Gratuit (on peut faire un don) | Oui MIT License | SVG | J'aime 1 |  | raphaeljs.com | Oui | Non | Oui | |
| Highcharts | Oui | Oui | Oui | Oui | Oui | Oui | Oui | Free for non commercial use and testing $ 90 (single website) - $ 3600 (10 developers license with maintenance and support for 12 months) | Oui CC by-nc 3.0 | HTML5 Canvas / SVG / VML | J'aime 18 |  | highcharts.com/... | Oui | Oui | Oui | |
| JenScriptJS | Oui | Oui | Oui | Oui | Oui | Oui | Free Open Source BSD | Oui | SVG | J'aime 2 | 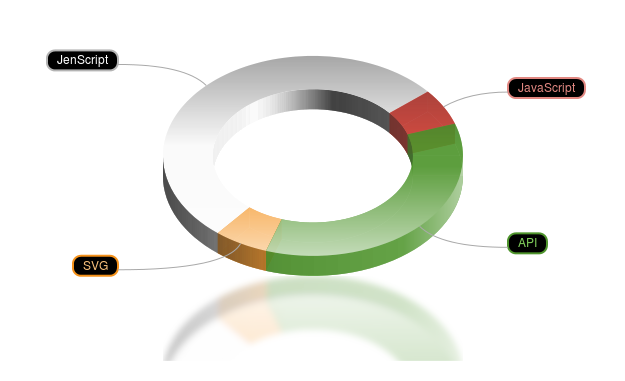 | Donut3D - Bar Chart - Ray Chart - Stock Chart | jenscript.io | Oui | Oui | Oui | |
| jqChart | Oui | Oui | Oui | Oui | Oui | Oui | Oui | $299 | Non | Canvas | J'aime 0 | 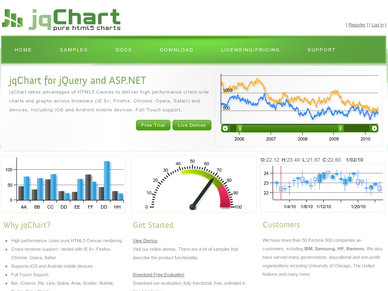 | Bubble, radar, polar | jqchart.com | Oui | Oui | Oui |
| jqPlot | Oui | Oui | Oui | Oui | Oui | Oui | Oui | Free | Oui MIT, GPL v2 | Canvas | J'aime 1 |  | jqplot.com | Oui | Oui | Oui turned off by default | |
| JSCharts | Oui | Non | Non | Non | Non | Oui | Non | $ 39 - $ 149 Gratuit avec un watermark | Non | Canvas | J'aime 1 |  | jscharts.com | Oui | Non | Non | |
| JSXGraph | Oui | Oui | Non | Oui | Oui | Gratuit | Oui LGPL | SVG | J'aime 0 |  | Math... | uni-bayreuth.de/wp/ | Oui | Oui | Oui no tooltips | ||
| KendoUI DataViz | Oui | Oui | Oui | Oui | Oui | Oui | Oui | $ 399 | Non | SVG | J'aime 4 |  | Linear Gauge, Radial Gauge, Bubble, Bullet, Donut, Scatter, Stock | telerik.com/... | Oui | Oui | Oui |
| KoolChart | Oui | Oui | Oui | Oui | Oui | Oui | Oui | Free with watermark. $100 for Lite version, $350 for Basic, $620 for Pro and $1,280 for Enterprise | Non | Canvas | J'aime 8 | 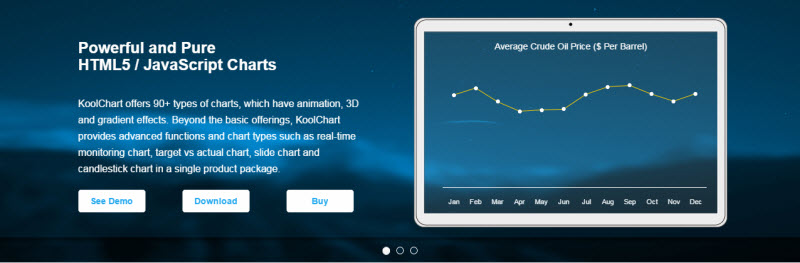 | Radar, Combination, From-To, Target vs Actual, History, Scroll, Real-time, Broken-axis, Matrix, Image, Wing, Gauge | koolchart.com | Oui | Oui | Oui |
| Morris.js | Oui | Oui | Non | Non | Non | Non | Non | Free | Oui Simplified BSD | SVG | J'aime 2 |  | github.io/... | Non | Non | Oui | |
| nvd3 | Oui | Oui | Oui | Oui | Oui | Free depending on Apache 2.0 | Oui Apache 2.0 | SVG | J'aime 4 |  | Bullet chart | github.com/... | Oui | Oui | Oui | ||
| OLAPCharts | Oui | Oui | Oui | Oui | Oui | Free charts, €99 with additional OLAP features | HTML5 Canvas, Flash | J'aime 0 |  | Spline, Donut, Rose, Radar, HeatMap, Combined | Oui | Oui | Oui | ||||
| Plotly | Oui | Oui | Oui | Oui From cloud version | Oui | Oui | Oui | Basic charts are free. $249/developer/year for advanced charts, $995/developer/year for 3d charts | - | D3.js and stackgl | J'aime 6 |  | histograms, box plots, time series, subplots, polar charts, multiple axes, insets, log plots, maps, contour plots, 2D histograms, error bars, 3D surface plots, 3D scatter plots, 3D line plots | plotly.com/... | Oui | Oui | Oui |
| Protovis | Oui | Oui | Oui | Non Workaround available | Oui | Oui | Oui | Gratuit | Oui BSD License | SVG | J'aime 1 |  | TreeMap, Node links | github.io/... | Oui | Oui | Non |
| Reportivo.com | Oui | Oui | Oui | Oui | Oui | Oui | Free | J'aime 6 |  | Range Bar/Area/Spline Area, Polar Bar/Area/Spline/Scatter/Stepline/Steparea | reportivo.com | Oui | Oui | ||||
| RGraph | Oui | Oui | Oui | Oui | Oui | Oui | Oui | Free (GPL) and commercial | Oui Open Source (GPL) + commercial | Canvas and SVG | J'aime 8 | Bipolar, Bar, Donut, Fuel, Funnel, Gantt, Gauge, Horizontal Bar, Horizontal Progress bar, Line, Meter, Pie, Radar, Rose, Scatter, Thermometer, Vertical Progress bar, Vertical Line chart, Waterfall, XY Plots, everything AJAX dynamic, Google Sheets support | rgraph.net | Oui | Oui | Oui | |
| Rickshaw | Oui | Oui | Oui | Free of charge with copyright attribution | Oui | SVG | J'aime 0 |  | shutterstock.com/... | Oui | Oui turned off by default | ||||||
| Sencha Touch Charts | Oui | Oui | Free under GPLv3 license; $999 commercial license | Non | Canvas | J'aime 0 |  | sencha.com/... | Oui tooltips on touch | ||||||||
| Shield UI Charts | Oui | Oui | Oui | Oui | Oui | Oui | Oui | Free for Non-commercial use. Requires license for commercial. OEM licensing available. | Non | SVG, VML | J'aime 7 |  | Range Bar/Area/SplineArea, Polar Bar/Area/Spline/Scatter, Stepline, Steparea | shieldui.com | Oui | Oui | Oui |
| SVGware | Oui | Oui | Oui | Oui | Oui | Oui | Oui | Free | Non | SVG | J'aime 0 | 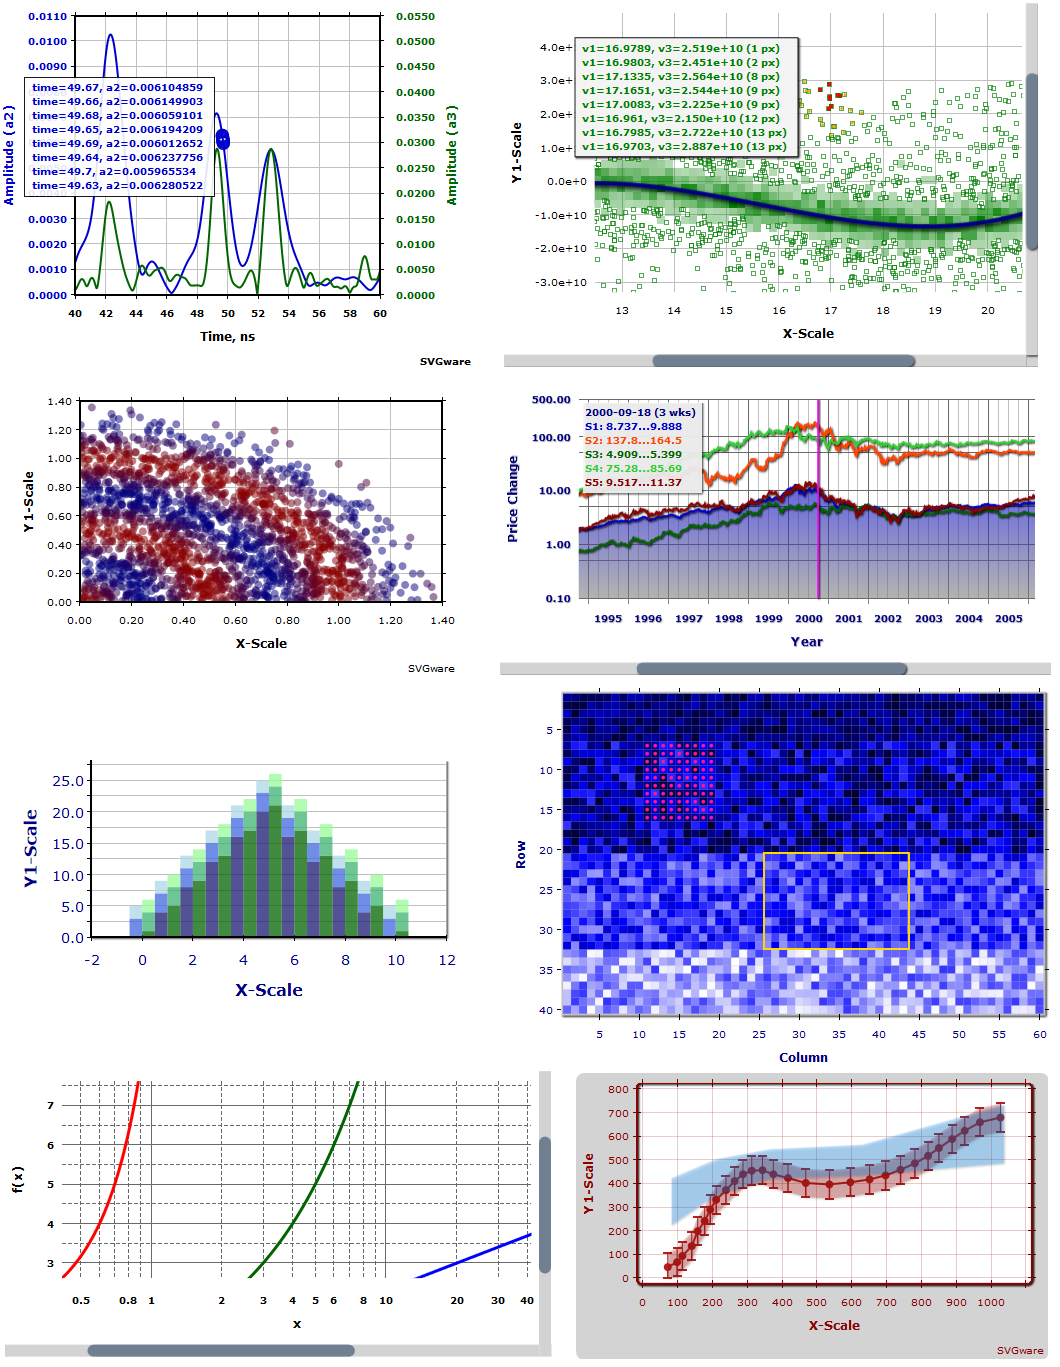 | heat map; error bars; linear and logarithmic scales; | Oui | Oui | Oui | |
| TeeChart | Oui | Oui | Oui | Oui | Oui | Oui | Oui | Free - MIT license | Oui | Canvas | J'aime 1 |  | Horizbar, SmoothLine, Donut, HorizArea, Bubble, Candle (OHLC) | github.com/... | Oui | Oui | Oui |
| VanCharts | Oui | Oui | Oui | Oui PNG, PDF, EXCEL | Oui | Oui | Oui | study, research or any non-profit project for free. Single developer $90. 5 Developers $200. 10 Developers $300. Unlimited $800. | Non | Canvas & VML | J'aime 1 | 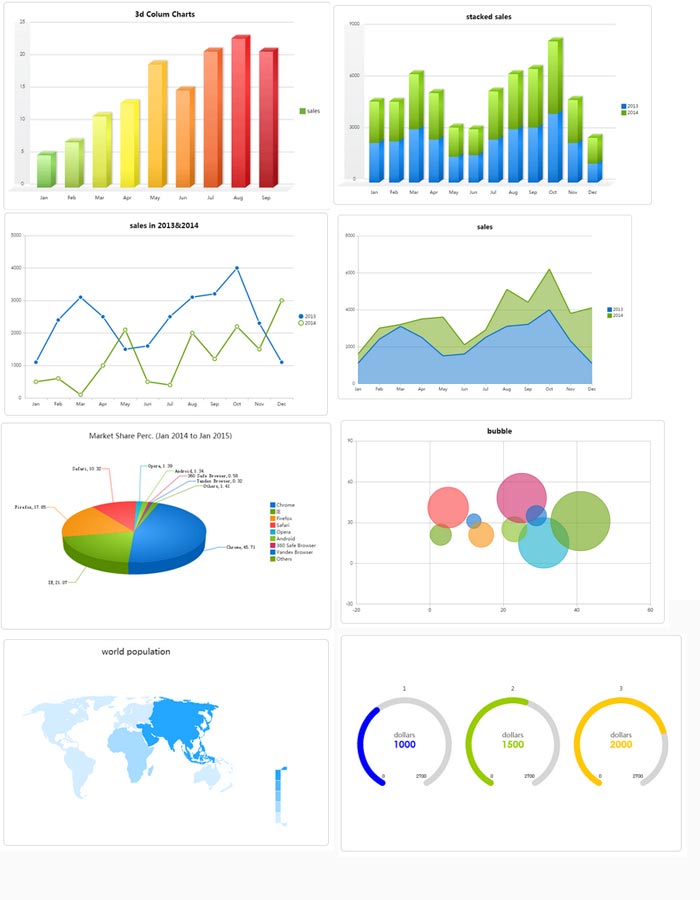 | map, GIS map, Gantt chart,Column Chart,Gauge Chart,Radar Chart,Custom Chart,range chart``` | Oui | Oui | Oui | |
| ZingChart | Oui | Oui | Oui | Oui | Oui | Oui | Oui | Full library free to use with small link. Licenses start at $199. SaaS and OEM available. | - | HTML5 Canvas / SVG / VML | J'aime 33 | 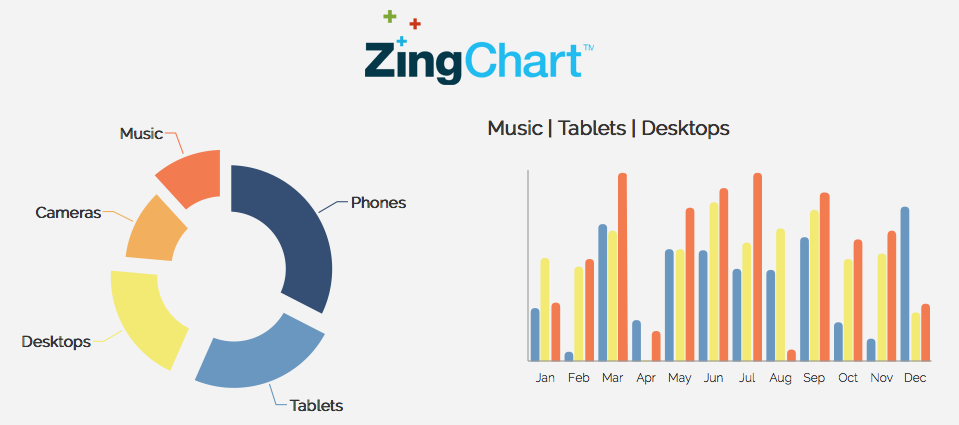 | Bullet, Chord, Funnel, Gauge, Grid, Maps, Pareto, Piano/Heatmap, Radar/Polar, Rankflow, Stock/OHLC, Treemap, Venn, WordCloud, Box plot, Population Pyramid, Waterfall, Calendar, Bubble Pie | zingchart.com | Oui | Oui | Oui |
| dc.js | Oui | Oui | Free | Oui | SVG | J'aime 1 |  | github.io/... | |||||||||
| Leaflet | Oui | J'aime 1 | 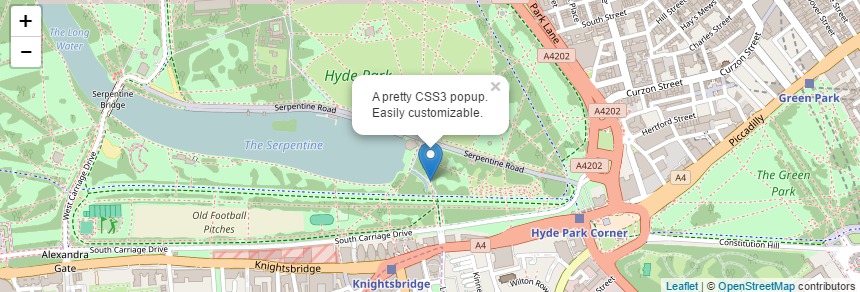 | leafletjs.com/... |


 30 plus
Avis utilisateurs et commentaires
Many bugs, not reliable, and expensive. Actualy relies on Raphael ... so use Raphael direclty !
What does external data loading mean? Does it not support dynamical json data from server.?
Testé avec angularjs
JavaScript Charts Library SVG
Raphaël currently supports Firefox 3.0+, Safari 3.0+, Chrome 5.0+, Opera 9.5+ and Internet Explorer 6.0+.