 Link | D3.js | Highcharts |
|---|---|---|
| Website | d3js.org | highcharts.com/... |
| Image | 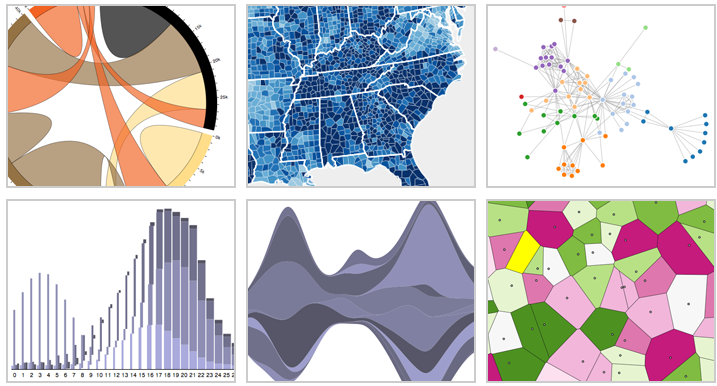 |  |
| Latest version | 2.10.3 | 1.0 |
| Like | Likes 16 | Likes 18 |
| Open source | Yes BSD License | Yes CC by-nc 3.0 |
| Internet Explorer | - IE 9 is supported, IE 8 is supported with Aight | Yes 6.0+ |
| Firefox | Yes | Yes |
| Safari | Yes | Yes |
| Google Chrome | Yes | Yes |
| Opera | Yes | Yes |
| iPhone | Yes | Yes |
| iPad | Yes | Yes |
| Export files | Yes | Yes |
| Demo web link | github.com/... | highcharts.com/... |
| Trial and Prices | Free under BSD | Free for non commercial use and testing $ 90 (single website) - $ 3600 (10 developers license with maintenance and support for 12 months) |
| Ability to zoom in and out of charts | Yes | Yes |
| Combination of charts | Yes | Yes |
| Data labels | Yes | Yes |
| Dot | Yes | No |
| Interactive charts | Yes | Yes |
| Annotations on the chart | No | Yes |
| Highlights region | Yes | No |
| Minified size | 116 kb | 45 kb |
| Sparklines | Yes | Yes |
| Other charts | D3.js is a drawing library, and not just a chart library. You can make virtually any visualization or graph given time. | |
| Gamme de prix | ||
| Dependencies | github.com/... for partial IE8 compatibility. No dependencies needed for other browsers supported | None |
| Graphic technology | SVG | HTML5 Canvas / SVG / VML |
| Candlestick | - Unofficial example: https://gist.github.com/1074045 | Yes Highstock, separate product |
| Donut | Yes | Yes |
| Source code repository | github.com/... | |
| Node / Edge graph | Yes | Yes |
| Bubble | Yes | Yes |
| Interactive (responds to mouse hover/click) | Yes | Yes |
| Events | Yes | Yes |