| amCharts | arcadiaCharts | CanvasJS Charts | D3.js | dhtmlxChart | Dojo (dojox/charting) | Ejschart | Elycharts | Flot | flotr2 | Google Chart Tools | gRaphaël | Highcharts | jqChart | JSCharts | JSXGraph | KendoUI DataViz | Morris.js | nvd3 | Protovis | RGraph | Rickshaw | Sencha Touch Charts | TeeChart | zingchart | |
|---|---|---|---|---|---|---|---|---|---|---|---|---|---|---|---|---|---|---|---|---|---|---|---|---|---|
| Website | http://www.amcharts.com/ | http://www.arcadiacharts.com/ | http://canvasjs.com | http://d3js.org/ | http://www.dhtmlx.com/docs/products/dhtmlxChart/index.shtml | http://dojotoolkit.org/features/graphics-and-charting | http://www.ejschart.com | http://elycharts.com | http://www.flotcharts.org/ | http://www.humblesoftware.com/flotr2/index | https://developers.google.com/chart/ | http://g.raphaeljs.com/ | http://www.highcharts.com/products/highcharts | http://www.jqchart.com | http://www.jscharts.com | http://jsxgraph.uni-bayreuth.de/ | http://www.kendoui.com/dataviz.aspx | http://www.oesmith.co.uk/morris.js/ | http://nvd3.com/ | http://vis.stanford.edu/protovis/ | http://www.rgraph.net/ | http://code.shutterstock.com/rickshaw/ | http://www.sencha.com/products/touch/charts | http://www.steema.com/teechart/html5 | http://www.zingchart.com |
| Demo web link | http://www.amcharts.com/javascript/ | http://www.arcadiacharts.com/line_chart | http://canvasjs.com/html5-javascript-column-chart/ | https://github.com/mbostock/d3/wiki/Gallery | http://www.dhtmlx.com/docs/products/dhtmlxChart/index.shtml | http://demos.dojotoolkit.org/demos/?cat=graphics | http://www.ejschart.com/examples.php?selected=examplePage | http://elycharts.com/examples | http://people.iola.dk/olau/flot/examples/ | http://www.humblesoftware.com/flotr2/index | https://developers.google.com/chart/interactive/docs/gallery | http://g.raphaeljs.com/ | http://highcharts.com/demo/ | http://www.jqchart.com/samples | http://www.jscharts.com/examples | http://jsxgraph.uni-bayreuth.de/wp/examples/ | http://demos.kendoui.com/dataviz/overview/index.html | http://www.oesmith.co.uk/morris.js/ | http://nvd3.com/ghpages/examples.html | http://vis.stanford.edu/protovis/ex/ | http://www.rgraph.net/demos | http://code.shutterstock.com/rickshaw/examples/ | http://dev.sencha.com/deploy/touch-charts-1.0.0/examples/ | http://www.steema.com/files/public/teechart/html5/jscript/demos/ | http://www.zingchart.com/#chart-gallery |
| Image |  |  |  |  |  | 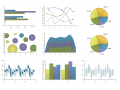 |  | 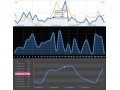 | 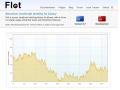 | 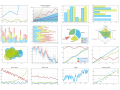 |  |  |  |  |  |  |  |  |  |  |  |  |  | ||
| Like | |||||||||||||||||||||||||
| Open source | No | No | Yes CC nc 3.0 | Yes BSD License | Yes GNU GPL | Yes BSD, AFLv2 | No | Yes MIT License | Yes MIT License | Yes MIT License | No | Yes MIT License | Yes CC by-nc 3.0 | No | No | Yes LGPL | No | Yes Simplified BSD | Yes Apache 2.0 | Yes BSD License | No | Yes | No | No | No |
| Latest version | 1.0.2 | 1.0 | 2.10.3 | 2.6 Build 100928 | 1.8 | 2.3 | 2.1.4-Snapshot (Aug, 2011) | 0.7 (march 2011) | 0.5.0 | 1.0 | 3.0 | 0.94 | Q1 2013 | 0.4.1 | 3.3.1 | 2012 | 2012 | 2012 | |||||||
| Trial and Prices | Free with watermark $99 (single website) | Free for non commercial use $ 89 (single website) - $ 899 (OEM) | Free for non-commercial use $299+ for commercial license | Free under BSD | Free under GNU GPL, $49 | Free | Free / $100 / $250 / $1000 | Free | Free | Free | Free | Free (you can donate) | Free for non commercial use $ 80 (single website) - $ 2000 (10 developers license) | $299 | $ 39 - $ 149 Free with watermark | Free | $ 399 | Free | Free depending on Apache 2.0 | Free | Free for non-commercial (CreativeCommons) License for commercial use. | Free of charge with copyright attribution | Free under GPLv3 license; $999 commercial license | Free for non commercial use. $129 commercial license ( 1developer + 1 server install + 1 year support subscription) | Single Domain Package : $249.00 Discounted Multi-Domain Package : $999.00 |
| Library size (compressed+gzip) | 27 KB | 35 KB | 500 KB (can easily be scaled down if you just use a subset of chart types) | 32 kb | 310 KB | 223 KB | 24 KB (only through google link, no offline mode) | 88.5 KB | 52 KB | 50 KB | 32 KB | 0.7 MB | |||||||||||||
| Minified size | 116 kb | 54 KB | 170 KB (can easily be scaled down if you just use a subset of chart types) | 65 KB | 96 KB | 28.5 KB | 45 kb | 439 KB | 29 KB | 153 KB | 4.7 MB | ||||||||||||||
| Dependencies | https://github.com/shawnbot/aight for partial IE8 compatibility. No dependencies needed for other browsers supported | None outside of the Dojo Toolkit | None | jQuery,Raphaël | jQuery | underscore.js, beam.js | Raphaël | jQuery 1.9+ | jQuery, Raphaël | d3.js and Aight for IE8 support | none | d3.js | |||||||||||||
| Graphic technology | SVG | Canvas | CanvasJS | SVG | Canvas | SVG, Canvas if not available VML or Silverlight | Canvas / SVG / VML | SVG | Canvas | Canvas | SVG | SVG | SVG | Canvas | Canvas | SVG | SVG | SVG | SVG | SVG | Canvas | Canvas | Canvas | Canvas | Canvas / SVG / VML / Flash |
| Charts types | |||||||||||||||||||||||||
| Area | Yes | Yes | Yes | Yes | Yes | Yes | Yes | Yes | Yes Line charts can also have fills | Yes | Yes Line charts can also have fills | Yes | Yes | No | No | Yes | Yes | Yes | Yes | Yes | Yes | Yes | Yes | Yes | |
| Areaspline | No | Yes | No | Yes | - In progress for next revision | Yes | Yes | No | No | No | Yes | Yes | No | No | Yes | Yes | Yes | Yes | Yes | Yes | |||||
| Bar | Yes | Yes | Yes | Yes | Yes | Yes | Yes | Yes | Yes | Yes | Yes | Yes (8 Kb) vertical only | Yes horizontal, vertical | Yes | Yes vertical only | Yes | Yes | Yes vertical only | Yes | Yes | Yes | Yes | Yes | Yes | Yes |
| Dot | No | Yes | Yes | No | Yes | Yes | Yes | Yes | No | No | Yes (2.5 Kb) | No | No | No | No | No | Yes | Yes | Yes | No | Yes | Yes | |||
| Line | Yes | Yes | Yes | Yes | Yes | Yes | Yes | Yes | Yes | Yes | Yes | Yes (4 Kb) | Yes | Yes | Yes | Yes | Yes | Yes | Yes | Yes | Yes | Yes | Yes | Yes | Yes |
| Pie | Yes | Yes | Yes | Yes | Yes | Yes | Yes | Yes | Yes | Yes | Yes | Yes (4 Kb) | Yes | Yes | Yes | Yes | Yes | No | Yes | Yes | Yes | Yes | Yes | Yes | |
| Scatter | Yes | Yes | Yes | No | Yes | Yes | No | Yes | Yes | Yes | No | Yes | Yes | No | No | Yes | No | Yes | Yes | Yes | Yes | Yes | Yes | ||
| Spline | Yes | Yes | Yes | Yes | - In progress for next revision | Yes | Yes | No | No | No | Yes | Yes | No | Yes | Yes | Yes | Yes | No | Yes | Yes | - Just in flash, Not in HTML5 | ||||
| Sparklines | No | Yes | Yes | Yes | - In progress for next revision | Yes | No | Yes | No | Yes | No | No | Yes | ||||||||||||
| Candlestick | Yes | No | - Unofficial example: https://gist.github.com/1074045 | No | Yes | Yes | No | Yes a custom plugin: http://jumflot.jumware.com/candlestick.html | Yes | Yes | No | Yes Highstock, separate product | Yes | No | No | Yes | No | No | Yes | No | No | Yes | Yes | ||
| Donut | Yes | Yes | Yes | Yes | Yes | No | Yes | Yes | Yes | No | No | No | Yes | No | No | No | Yes | Yes | Yes | Yes | Yes | No | Yes | Yes | |
| Node / Edge graph | Yes | ||||||||||||||||||||||||
| Other charts | Bubble Chart | D3.js is a drawing library, and not just a chart library. You can make virtually any visualization or graph given time. | Bubble, Candlestick (OHLC), Spider. Other Dojo modules provide as well TreeMap, Gauges etc... | f(x), Gauge, Donut, alarm, candle stick, step series, over under, open high low, error series, stacked bar, trend, and floating bar | Funnel | Bubbles, Gantt, Pyramid, Spider | Bubble, radar | Geo chart, table, gauge, tree map | Bubble, radar, polar | Math... | Linear Gauge, Radial Gauge, Bubble, Bullet, Donut, Scatter, Stock | Bullet chart | TreeMap, Node links | Gauge, Funnel, Waterfall | Horizbar, SmoothLine, Donut, HorizArea, Bubble, Candle (OHLC) | ||||||||||
| Features | |||||||||||||||||||||||||
| Ability to zoom in and out of charts | Yes | Yes | Yes | No | Yes | Yes | No | Yes | Yes | No | No | Yes | Yes | No | No | Yes | No | Yes | Yes | No | Yes | Yes | Yes | ||
| Annotations on the chart | No | Yes | No | Yes | No | Yes | Yes | No | No | No | Yes | No | Yes | No | Yes | Yes | No | Yes | Yes | ||||||
| Combination of charts | Yes | Yes | Yes | Yes | No | Yes | Yes | No | Yes | Yes | Yes | No | Yes | Yes | Yes | Yes | Yes | No | Yes | Yes | No | Yes | Yes | ||
| Clickable points | Yes | Yes | Yes | Yes | Yes | Yes | Yes | Yes | No | Yes | Yes | No | Yes | Yes | Yes | No | Yes | Yes | Yes | ||||||
| Date-time axis | Yes | Yes | Yes | No | - Feasible with custom code | Yes | No | Yes | Yes | No | Yes | Yes | No | Yes | Yes | Yes | Yes | No | Yes | Yes | |||||
| Dynamic charts | Yes | Yes | Yes | Yes | Yes | Yes | Yes | Yes | Yes | No | No | Yes | Yes | No | Yes | Yes | Yes | Yes | No | Yes | Yes | ||||
| Export files | No | Yes SVG | - | No | No | Yes PNG, JPG | No | No | Yes | Yes | No | Yes | No | No Workaround available | - | Yes | Yes | ||||||||
| External Data Loading | Yes | Yes Using dojo/store | Yes | No | Yes | No | No | No | Yes | Yes | No | Yes | Yes | No | Yes | Yes | Yes | Yes | |||||||
| Highlights region | Yes | No | Yes | Yes | Yes | No | No | No | No | Yes | Yes | Yes | No | Yes | |||||||||||
| Data labels | Yes | Yes | Yes | Yes | - Only on a subet of charts, improvement planned for future versions | Yes | Yes | Yes | No | Yes | Yes | Yes | Yes | Yes | Yes | No | Yes | Yes | No | Yes | Yes | Yes | |||
| Text Rotation for Labels | Yes | Yes With CSS | Yes | Yes | Yes | Yes | No | No | Yes | Yes | No | No | No | No | Yes | Yes | Yes | ||||||||
| Interactive charts | Yes | Yes | Yes | Yes mouse & touch (mobile) interaction | Yes | Yes | Yes | Yes | Yes | Yes | Yes | Yes | No | Yes | Yes | Yes | Yes | Yes | Yes | Yes | Yes | Yes | |||
| No | Yes | Yes | Yes | No | No | No | No | Yes | No | Yes | No | Yes | |||||||||||||
| Tooltips about data points | Yes | Yes | Yes | Yes | Yes | Yes | Yes | Yes | Yes | Yes | Yes | Yes | Yes | Yes | No | Yes | Yes | Yes | Yes | No | Yes | Yes | Yes | ||
| Google Maps Support | No | No | No | No | No | No | No | No | Yes | No | |||||||||||||||
| Platforms | |||||||||||||||||||||||||
| Firefox | Yes | Yes | Yes | Yes | Yes 1.0+ | Yes 3.6+ | Yes 1.5+ | Yes 3.0+ | Yes | Yes | Yes | Yes 3.0+ | Yes | Yes | Yes 1.5+ | Yes 2.0+ | Yes | Yes | Yes | Yes | Yes | Yes | Yes | Yes | |
| Internet Explorer | Yes | Yes | Yes 9+ | - IE 9 is supported, IE 8 is supported with Aight | Yes 6.0+ | Yes 6+ | Yes 6.0+ | Yes 6.0+ | Yes 6.0+ | Yes 6.0+ | Yes | Yes 6.0+ | Yes 6.0+ | Yes 6.0+ | Yes 6.0+ | Yes 6.0+ | Yes 7+ | Yes 6.0+ | - IE 9, IE8 requires Aight | No Partial | - IE 9, IE8 requires Aight or Google Chrome Frame or Google ExCanvas | - IE 9, IE8 requires Aight | Yes 9.0+ | Yes 6.0+ | |
| Google Chrome | Yes | Yes | Yes | Yes | Yes | Yes | Yes | Yes 5.0+ | Yes | Yes | Yes | Yes 5.0+ | Yes | Yes | Yes | Yes | Yes | Yes | Yes | Yes | Yes | Yes | Yes | ||
| Safari | Yes | Yes | Yes | Yes | Yes 3.0+ | Yes | Yes 3.1 (2.0 on MAC) | Yes 3.0+ | Yes | Yes | Yes | Yes 3.0+ | Yes | Yes | Yes 3.1+ | Yes 3.0+ | Yes | Yes | Yes | Yes | Yes | Yes | Yes | ||
| Opera | Yes | Yes | Yes | Yes | Yes 9.0+ | - Might work but not officially supported | Yes 9+ | Yes 9.5+ | Yes | Yes | Yes 9.5+ | Yes | Yes | Yes 9+ | Yes | Yes | Yes | Yes | Yes | Yes | Yes | ||||
| iPhone | Yes | Yes | Yes | Yes | Yes | Yes | Yes 1+ | Yes | Yes | Yes | Yes | Yes | Yes 1.0+ | Yes | Yes | Yes | Yes | Yes | Yes | Yes | Yes | Yes | Yes | ||
| iPad | Yes | Yes | Yes | Yes | Yes | Yes | Yes | Yes | Yes | Yes | Yes | Yes | Yes | Yes | Yes | Yes | Yes | Yes | Yes | Yes | Yes | Yes | Yes | ||
| Social Networks | |||||||||||||||||||||||||
| Source code repository | https://github.com/flot/flot | https://github.com/HumbleSoftware/Flotr2 | https://github.com/DmitryBaranovskiy/g.raphael | https://github.com/oesmith/morris.js | https://github.com/RobertLowe/nvd3 | ||||||||||||||||||||
| http://twitter.com/amcharts | http://twitter.com/dhtmlx | https://twitter.com/dojo | https://twitter.com/ejscharts | http://twitter.com/Elycharts | http://twitter.com/RaphaelJS | http://twitter.com/Highcharts | http://twitter.com/jqChart | http://twitter.com/jecomponents | http://twitter.com/KendoUI | http://twitter.com/olly_smith | http://twitter.com/sencha | https://twitter.com/#!/SteemaSoftware | https://twitter.com/zingchart | ||||||||||||
| Website | http://www.amcharts.com/ | http://www.arcadiacharts.com/ | http://canvasjs.com | http://d3js.org/ | http://www.dhtmlx.com/docs/products/dhtmlxChart/index.shtml | http://dojotoolkit.org/features/graphics-and-charting | http://www.ejschart.com | http://elycharts.com | http://www.flotcharts.org/ | http://www.humblesoftware.com/flotr2/index | https://developers.google.com/chart/ | http://g.raphaeljs.com/ | http://www.highcharts.com/products/highcharts | http://www.jqchart.com | http://www.jscharts.com | http://jsxgraph.uni-bayreuth.de/ | http://www.kendoui.com/dataviz.aspx | http://www.oesmith.co.uk/morris.js/ | http://nvd3.com/ | http://vis.stanford.edu/protovis/ | http://www.rgraph.net/ | http://code.shutterstock.com/rickshaw/ | http://www.sencha.com/products/touch/charts | http://www.steema.com/teechart/html5 | http://www.zingchart.com |