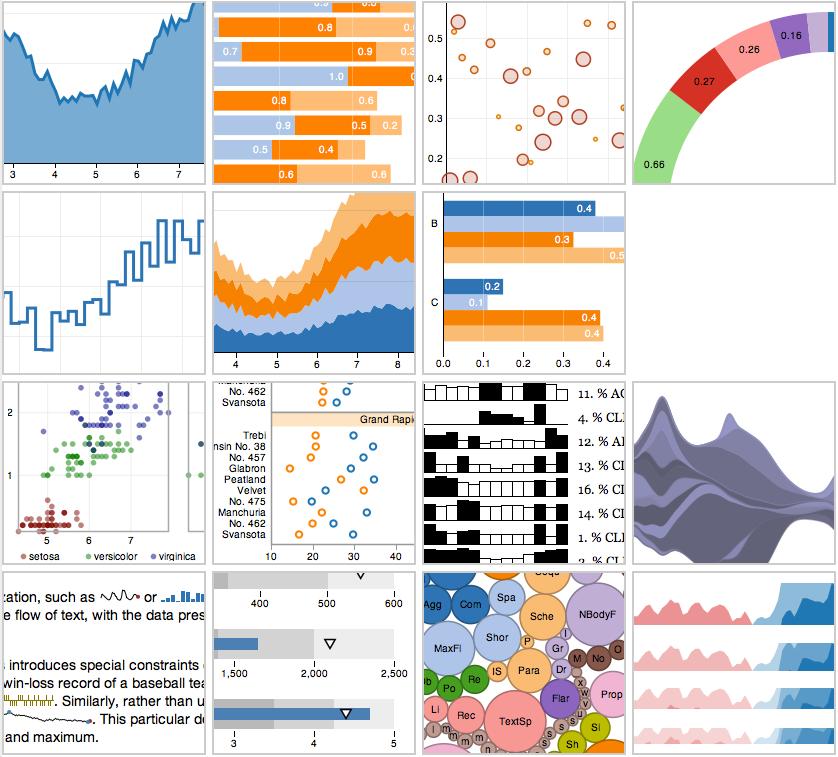
Protovis

Likes 1
Name | Protovis |
|---|---|
| Website | github.io/... |
| Demo web link | github.io/... |
| Open source | Yes BSD License |
| Latest version | 3.3.1 |
| Trial and Prices | Free |
| Minified size | 4.7 MB |
| Dependencies | |
| Graphic technology | SVG |
| Charts types | |
| Area | Yes |
| Bar | Yes |
| Bubble | Yes |
| Line | Yes |
| Pie | Yes |
| Scatter | Yes |
| Spline | Yes |
| Sparklines | Yes |
| Candlestick | Yes |
| Donut | Yes |
| Node / Edge graph | Yes |
| Other charts | TreeMap, Node links |
| Features | |
| Events | |
| Multitouch | |
| Ability to zoom in and out of charts | Yes |
| Annotations on the chart | Yes |
| Combination of charts | Yes |
| Data labels | Yes |
| Date-time axis | Yes |
| Dynamic charts | Yes |
| Export files | No Workaround available |
| External Data Loading | Yes |
| Interactive (responds to mouse hover/click) | No |
| Text Rotation for Labels | Yes |
| Platforms | |
| Firefox | Yes |
| Internet Explorer | No Partial |
| Google Chrome | Yes |
| Safari | Yes |
| Opera | |
| iPhone | Yes |
| iPad | Yes |
| Social Networks | |
| Source code repository | |
| Website | github.io/... |


User reviews and comments