Charts


J'aime 0
Compare AnyChart vs D3.js vs Google Chart Tools vs Highcharts vs KendoUI DataViz vs nvd3 vs Plotly vs ZingChart
Compare AnyChart vs D3.js vs Google Chart Tools vs Highcharts vs KendoUI DataViz vs nvd3 vs Plotly vs ZingChart
Lien | Site web | Lien de démonstration | Image | J'aime | Open source | Dernière version | Gamme de prix | Taille minifié | Dépendances | Graphic technology | Types de Graphiques | Area | Bar | Bubble | Line | Pie | Scatter | Spline | Sparklines | Candlestick | Donut | Node / Edge graph | Other charts | Fonctionnalités | Multitouch | Possibilité de zoomer + ou - sur les graphiques | Annotations sur le graphique | Combinaison de graphiques | Libellés des données | Axe date-temps | Graphiques dynamiques | Export de fichiers | Chargement de données externes | Interactive (responds to mouse hover/click) | Impression | Rotation du texte pour les libellés | Plateformes | Firefox | Internet Explorer | Google Chrome | Safari | Opera | iPhone | iPad | Réseaux sociaux | Source code repository | X (Twitter) | Site web |
|---|---|---|---|---|---|---|---|---|---|---|---|---|---|---|---|---|---|---|---|---|---|---|---|---|---|---|---|---|---|---|---|---|---|---|---|---|---|---|---|---|---|---|---|---|---|---|---|---|
| AnyChart | anychart.com | anychart.com/... | 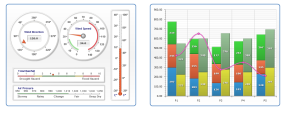 | J'aime 33 | Oui | 8.x | Education / Non-profit licensing - free. Commercial licenses start from $49: anychart.com/... | 147 KB | None | SVG or VML for old IE | Oui | Oui | Oui | Oui | Oui | Oui | Oui | Oui | Oui | Oui | Oui | Gauges, Radar, Polar, Stepline, Step, OHLC, Range Area, Range Bar, Funnel, Pyramid, Maps, Gantt, Stock, Bullet, Box, Error, Radar, Polar, and more | Oui | Oui | Oui | Oui | Oui | Oui | Oui PNG, JPG, SVG, PDF | Oui | Oui | Oui | Oui | Oui | Oui 6+ | Oui | Oui | Oui | Oui | Oui | github.com/... | @anychart | anychart.com | |||||
| D3.js | d3js.org | github.com/... | 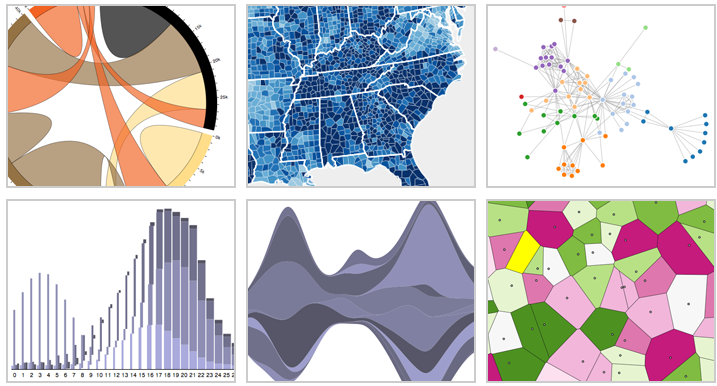 | J'aime 16 | Oui BSD License | 4.9.1 | Free under BSD | 116 kb | github.com/... for partial IE8 compatibility. No dependencies needed for other browsers supported | SVG | Oui | Oui | Oui | Oui | Oui | Oui | Oui | Oui | - Unofficial example: https://gist.github.com/1074045 | Oui | Oui | D3.js is a drawing library, and not just a chart library. You can make virtually any visualization or graph given time. | Oui | Non | Oui | Oui | Oui | Oui | Oui | Oui | Oui x-y coordinates(of text) needs to be changed after rotation of text | Oui | - IE 9 is supported, IE 8 is supported with Aight | Oui | Oui | Oui | Oui | Oui | github.com/... | d3js.org | ||||||||
| Google Chart Tools | google.com/... | google.com/... | J'aime 2 | Non | Free | SVG | Oui | Oui | Oui | Oui | Oui | Oui | Non | Non | Oui | Oui | Geo chart, table, gauge, tree map | Non | Oui new Annotation charts available in 2015 | Oui | Non | Oui | Non | Non | Non | Oui | Non | Non | Oui | Oui | Oui | Oui | Oui | Oui | Oui | google.com/... | ||||||||||||
| Highcharts | highcharts.com/... | highcharts.com/... |  | J'aime 18 | Oui CC by-nc 3.0 | 5.0.12 | Free for non commercial use and testing $ 90 (single website) - $ 3600 (10 developers license with maintenance and support for 12 months) | 45 kb | None | HTML5 Canvas / SVG / VML | Oui | Oui horizontal, vertical | Oui | Oui | Oui | Oui | Oui | Oui | Oui Highstock, separate product | Oui | Oui | Oui | Oui | Oui | Oui | Oui | Oui | Oui | Oui | Oui | Oui | Oui | Oui | Oui 6.0+ | Oui | Oui | Oui | Oui | Oui | @Highcharts | highcharts.com/... | |||||||
| KendoUI DataViz | telerik.com/... | kendoui.com/... |  | J'aime 4 | Non | Q1 2013 | $ 399 | jQuery 1.9+ | SVG | Oui | Oui | Oui | Oui | Oui | Oui | Non | Oui | Oui | Oui | Linear Gauge, Radial Gauge, Bubble, Bullet, Donut, Scatter, Stock | Oui | Oui | Oui | Oui | Oui | Oui | Oui | Oui | Oui | Oui | Oui | Oui | Oui 7+ | Oui | Oui | Oui | Oui | Oui | @KendoUI | telerik.com/... | ||||||||
| nvd3 | github.com/... | 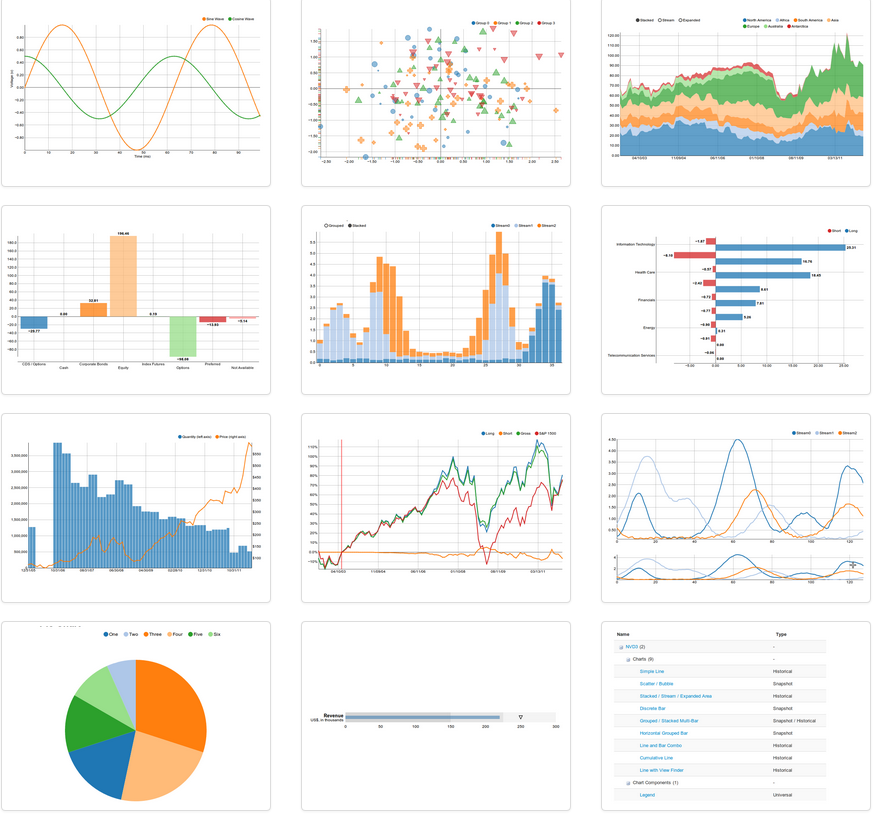 | J'aime 4 | Oui Apache 2.0 | Free depending on Apache 2.0 | 153 KB | d3.js and Aight for IE8 support - VERY cool but based on D3, no IE8 and prior. | SVG | Oui | Oui | Oui | Oui | Oui | Oui | Oui | Non | Oui | Non | Bullet chart | Oui | Oui | Oui | Oui | Oui | Oui | Oui | - IE 9, IE8 requires Aight | Oui | Oui | Oui | Oui | Oui | github.com/... | github.com/... | ||||||||||||||
| Plotly | plotly.com/... | plotly.com/... |  | J'aime 7 | - | 1.0 | Basic charts are free. $249/developer/year for advanced charts, $995/developer/year for 3d charts | 186 kb | D3.js and stackgl | Oui | Oui | Oui | Oui | Non | Oui | Oui | Oui | histograms, box plots, time series, subplots, polar charts, multiple axes, insets, log plots, maps, contour plots, 2D histograms, error bars, 3D surface plots, 3D scatter plots, 3D line plots | Oui | Oui | Oui | Oui | Oui | Oui | Oui From cloud version | Oui | Oui | Oui cloud version | Oui | Oui | Oui IE 8 + | Oui | Oui | Oui | Oui | Oui | github.com/... | @plotlygraphs | plotly.com/... | |||||||||
| ZingChart | zingchart.com | zingchart.com/... |  | J'aime 39 | - | 2.5.1 (2016) | Full library free to use with small link. Licenses start at $199. SaaS and OEM available. | None | HTML5 Canvas / SVG / VML | Oui | Oui | Oui | Oui | Oui | Oui | Oui | Oui | Oui | Oui | - In development | Bullet, Chord, Funnel, Gauge, Grid, Maps, Pareto, Piano/Heatmap, Radar/Polar, Rankflow, Stock/OHLC, Treemap, Venn, WordCloud, Box plot, Population Pyramid, Waterfall, Calendar, Bubble Pie | Oui | Oui | Oui | Oui | Oui | Oui | Oui | Oui | Oui | Oui | Oui | Oui | Oui 6.0+ | Oui | Oui | Oui | Oui | Oui | @zingchart | zingchart.com |


 9 plus
Avis utilisateurs et commentaires
Testé avec angularjs