Compare Sizes
Register
Français Español

KoolChart

8

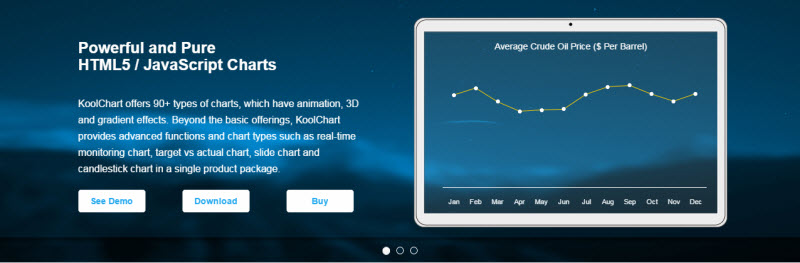
Koolchart is a pure JavaScript charting library. It is used to create interactive charts.KoolChart offers number of types of charts, like animation, 3D and gradient effects charts. KoolChart provides advanced functions and chart types such as real-time monitoring chart, target vs actual chart, slide chart and candlestick chart in a single product package.

Different types of animation effects, and zoom can be applied to all types of charts.

Comments can be added to any place in the chart

Javascript Graphs and Charts libraries
Name
KoolChart
Websitekoolchart.com
Demo web linkkoolchart.com/...
Open sourceNo
Latest version3.0
Trial and PricesFree with watermark. $100 for Lite version, $350 for Basic, $620 for Pro and $1,280 for Enterprise
Minified size450 K
Dependenciesnone
Graphic technologyCanvas
Charts types
AreaYes
BarYes
BubbleYes
LineYes
PieYes
ScatterYes
SplineYes
Sparklines
CandlestickYes
DonutYes
Node / Edge graph
Other chartsRadar, Combination, From-To, Target vs Actual, History, Scroll, Real-time, Broken-axis, Matrix, Image, Wing, Gauge
Features
Events
Multitouch
Ability to zoom in and out of chartsYes
Annotations on the chartYes
Combination of chartsYes
Data labelsYes
Date-time axisYes
Dynamic chartsYes
Export filesYes
External Data LoadingYes
Interactive (responds to mouse hover/click)Yes
PrintYes
Text Rotation for LabelsYes
Platforms
FirefoxYes
Internet ExplorerYes 6.0+
Google ChromeYes
SafariYes
OperaYes
iPhoneYes
iPadYes
Social Networks
Source code repository
Twitter
Websitekoolchart.com
IT development
English
Public
Public
Nov. 16th 2020 11:51:48 PM
View changes

User reviews and comments

  • bigdady on Nov. 26th 2014 6:22:36 AM
    like this

    excellent

  • seven arms on Nov. 26th 2014 6:10:54 AM
    like this

    Good !! various chart's types

  • whyhitme on Nov. 26th 2014 1:25:30 AM
    like this

    this is a very useful.

  • Spl on Nov. 26th 2014 1:24:49 AM
    like this

    it is very useful chart.

  • Leonard on Nov. 26th 2014 1:21:50 AM
    like this

    easy to use and faster than other charts