RPND


Le gusta 0
Enlace | Sitio web | Demo web link | Imagen | Me gusta | Open source | Latest version | Trial and Prices | Minified size | Dependencies | Graphic technology | Charts types | Area | Bar | Bubble | Line | Pie | Scatter | Spline | Sparklines | Candlestick | Donut | Node / Edge graph | Other charts | Características | Multitouch | Ability to zoom in and out of charts | Annotations on the chart | Combination of charts | Data labels | Date-time axis | Dynamic charts | Export files | External Data Loading | Interactive (responds to mouse hover/click) | Text Rotation for Labels | Platforms | Firefox | Internet Explorer | Google Chrome | Safari | Opera | iPhone | iPad | Social Networks | Source code repository | Sitio web | ||
|---|---|---|---|---|---|---|---|---|---|---|---|---|---|---|---|---|---|---|---|---|---|---|---|---|---|---|---|---|---|---|---|---|---|---|---|---|---|---|---|---|---|---|---|---|---|---|---|---|
| D3.js | d3js.org | github.com/... | 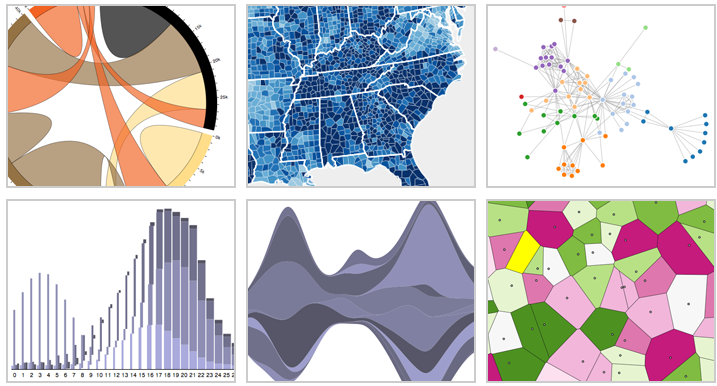 | Le gusta 16 | Sí BSD License | 2.10.3 | Free under BSD | 116 kb | github.com/... for partial IE8 compatibility. No dependencies needed for other browsers supported | SVG | Sí | Sí | Sí | Sí | Sí | Sí | Sí | Sí | - Unofficial example: https://gist.github.com/1074045 | Sí | Sí | D3.js is a drawing library, and not just a chart library. You can make virtually any visualization or graph given time. | Sí | No | Sí | Sí | Sí | Sí | Sí | Sí | Sí x-y coordinates(of text) needs to be changed after rotation of text | Sí | - IE 9 is supported, IE 8 is supported with Aight | Sí | Sí | Sí | Sí | Sí | github.com/... | d3js.org | ||||||||
| nvd3 | github.com/... | 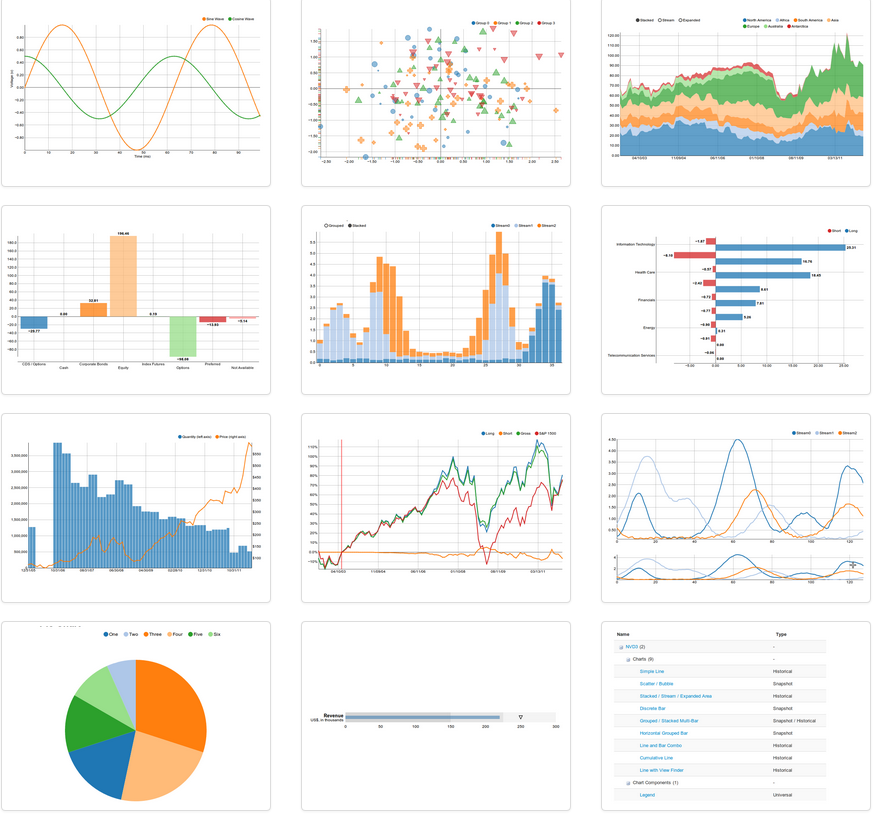 | Le gusta 4 | Sí Apache 2.0 | Free depending on Apache 2.0 | 153 KB | d3.js and Aight for IE8 support - VERY cool but based on D3, no IE8 and prior. | SVG | Sí | Sí | Sí | Sí | Sí | Sí | Sí | No | Sí | No | Bullet chart | Sí | Sí | Sí | Sí | Sí | Sí | Sí | - IE 9, IE8 requires Aight | Sí | Sí | Sí | Sí | Sí | github.com/... | github.com/... | ||||||||||||||
| Plotly | plotly.com/... | plotly.com/... |  | Le gusta 6 | - | 1.0 | Basic charts are free. $249/developer/year for advanced charts, $995/developer/year for 3d charts | 186 kb | D3.js and stackgl | Sí | Sí | Sí | Sí | No | Sí | Sí | Sí | histograms, box plots, time series, subplots, polar charts, multiple axes, insets, log plots, maps, contour plots, 2D histograms, error bars, 3D surface plots, 3D scatter plots, 3D line plots | Sí | Sí | Sí | Sí | Sí | Sí | Sí From cloud version | Sí | Sí | Sí cloud version | Sí | Sí | Sí IE 8 + | Sí | Sí | Sí | Sí | Sí | github.com/... | @plotlygraphs | plotly.com/... | |||||||||
| Rickshaw | shutterstock.com/... | shutterstock.com/... | 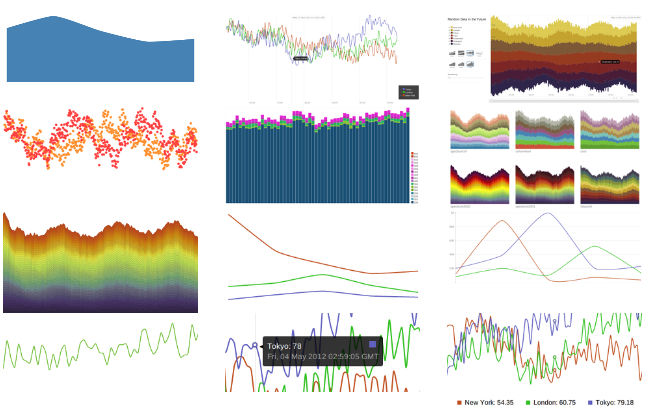 | Le gusta 0 | Sí | 2012 | Free of charge with copyright attribution | d3.js | SVG | Sí | Sí vertical only | No | Sí | No | Sí | Sí by default | No | Sí | Sí | Sí turned off by default | Sí | - IE 9, IE8 requires Aight | Sí | Sí | Sí | Sí | Sí | github.com/... | shutterstock.com/... | |||||||||||||||||||
| dc.js | github.io/... | github.io/... |  | Le gusta 1 | Sí | 1.7.3 | Free | d3.js crossfilter.js | SVG | Sí | Sí | Sí | Sí | Sí | Sí | Sí | github.io/... |


User reviews and comments