ss


Le gusta 0
Enlace | CanvasJS Charts | Google Chart Tools | Chart.js |
|---|---|---|---|
| Sitio web | canvasjs.com | google.com/... | chartjs.org |
| Demo web link | canvasjs.com/... | google.com/... | chartjs.org/... |
| Imagen | 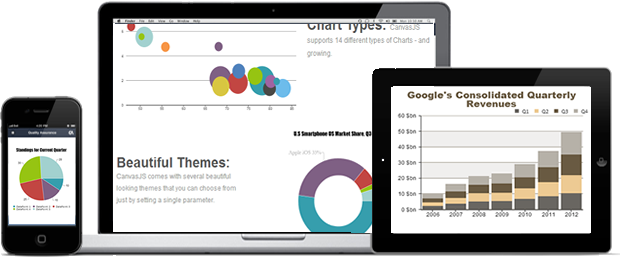 | ||
| Me gusta | Le gusta 4 | Le gusta 2 | Le gusta 7 |
| Open source | Sí CC nc 3.0 | No | Sí |
| Latest version | 3.7.10 | 4.3.0 (2023-03-07) | |
| Trial and Prices | 999 - Saas | Free | |
| Minified size | |||
| Dependencies | None | None | |
| Graphic technology | HTML5 Canvas | SVG | Canvas |
| Charts types | |||
| Area | Sí | Sí | Sí |
| Bar | Sí | Sí | Sí |
| Bubble | Sí | Sí | Sí |
| Line | Sí | Sí | Sí |
| Pie | Sí | Sí | Sí |
| Scatter | Sí | Sí | Sí |
| Spline | Sí | No | Sí |
| Sparklines | No | ||
| Candlestick | Sí | Sí | |
| Donut | Sí | Sí | Sí |
| Node / Edge graph | |||
| Other charts | Spline, Step Line, OHLC, Scatter, Funnel, Pyramid, Step Area, Stacked Area, Stacked Area 100%, Range Area, Range Spline Area, Stacked Column, Stacked Column 100%, Range Column, Stacked Bar, Stacked Bar 100%, Range Bar | Geo chart, table, gauge, tree map | |
| Características | |||
| Events | Sí | ||
| Multitouch | |||
| Ability to zoom in and out of charts | Sí | No | |
| Annotations on the chart | Sí Indexlabels | Sí new Annotation charts available in 2015 | |
| Combination of charts | Sí | Sí | |
| Data labels | Sí | No | |
| Date-time axis | Sí | Sí | |
| Dynamic charts | Sí | No | |
| Export files | Sí | No | |
| External Data Loading | No | ||
| Interactive (responds to mouse hover/click) | Sí | Sí | |
| Sí | No | ||
| Text Rotation for Labels | Sí | No | |
| Platforms | |||
| Firefox | Sí | Sí | |
| Internet Explorer | Sí IE8+ | Sí | |
| Google Chrome | Sí | Sí | |
| Safari | Sí | Sí | |
| Opera | Sí | Sí | |
| iPhone | Sí | Sí | |
| iPad | Sí | Sí | |
| Social Networks | |||
| Source code repository | |||
| X (Twitter) | @canvasjs | ||
| Sitio web | canvasjs.com | google.com/... | chartjs.org |


User reviews and comments