Chart js C3 D3 Highchart FusionCharts Google Chart

J'aime 0
Compare ZoomCharts D3.js vs Highcharts vs FusionCharts and others
Lien | D3.js | ZoomCharts | Highcharts | ZingChart | FusionCharts | Google Chart Tools | Protovis | JSCharts |
|---|---|---|---|---|---|---|---|---|
| Site web | d3js.org | zoomcharts.com | highcharts.com/... | zingchart.com | fusioncharts.com | google.com/... | github.io/... | jscharts.com |
| Lien de démonstration | github.com/... | zoomcharts.com | highcharts.com/... | zingchart.com/... | fusioncharts.com/... | google.com/... | github.io/... | jscharts.com/... |
| Image |  |  |  |  | |  | 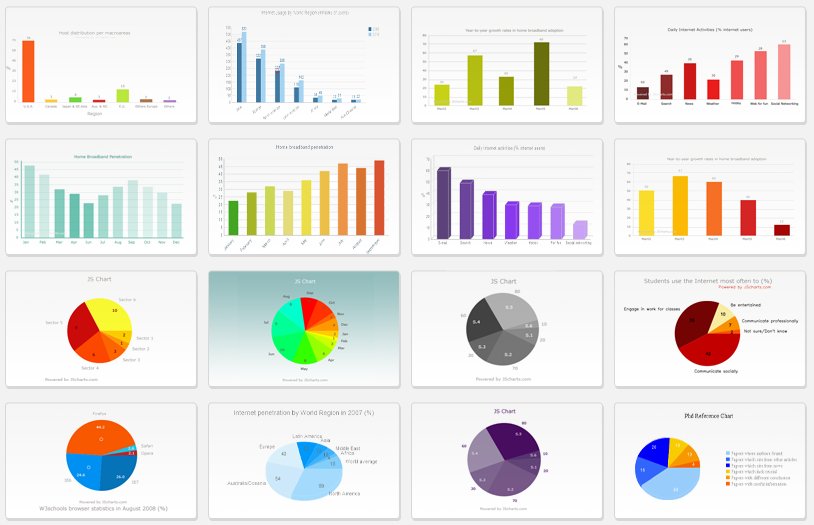 | |
| J'aime | J'aime 16 | J'aime 3 | J'aime 18 | J'aime 39 | J'aime 11 | J'aime 2 | J'aime 1 | J'aime 6 |
| Open source | Oui BSD License | Non Commercial | Oui CC by-nc 3.0 | - | Non | Non | Oui BSD License | Non |
| Dernière version | 4.9.1 | 1.16 | 5.0.12 | 2.5.1 (2016) | 3.12.0 | 3.3.1 | 3.0 | |
| Gamme de prix | Free under BSD | 30 day free trial. Licenses start at 948 USD/paid annually. Valid for SaaS, Unlimited Developers, Maintenance, Upgrades & Standard Support included. | Free for non commercial use and testing $ 90 (single website) - $ 3600 (10 developers license with maintenance and support for 12 months) | Full library free to use with small link. Licenses start at $199. SaaS and OEM available. | 999 | Free | Gratuit | $ 39 - $ 149 Gratuit avec un watermark |
| Taille de la librairie (compressée+gzip) | 553 KB | 24 KB (only through google link, no offline mode) | 32 KB | |||||
| Taille minifié | 116 kb | 224 KB (Minified + gzip) | 45 kb | 553 KB | 4,7 MB | |||
| Dépendances | github.com/... for partial IE8 compatibility. No dependencies needed for other browsers supported | None | None | None | None | |||
| Graphic technology | SVG | Canvas | HTML5 Canvas / SVG / VML | HTML5 Canvas / SVG / VML | SVG / VML | SVG | SVG | Canvas |
| Types de Graphiques | ||||||||
| Area | Oui | Oui With lots of options | Oui | Oui | Oui | Oui | Oui | Non |
| Bar | Oui | Oui Stacked, multiple series etc | Oui horizontal, vertical | Oui | Oui | Oui | Oui | Oui vertical only |
| Bubble | Oui | Oui | Oui | Oui | Oui | Oui | Non | |
| Line | Oui | Oui Various options | Oui | Oui | Oui | Oui | Oui | Oui |
| Pie | Oui | Oui With unlimited levels of drill-down, expandable others/previous slices and many settings | Oui | Oui | Oui | Oui | Oui | Oui |
| Scatter | Oui | Oui | Oui | Oui | Oui | Oui | Non | |
| Spline | Oui | Oui | Oui | Oui | Non | Oui | Non | |
| Sparklines | Oui | Oui | Oui | Oui | Non | Oui | ||
| Candlestick | - Unofficial example: https://gist.github.com/1074045 | Oui | Oui Highstock, separate product | Oui | Oui | Oui | Oui | Non |
| Donut | Oui | Oui With unlimited levels of drill-down, expandable others/previous slices and many settings | Oui | Oui | Oui | Oui | Oui | Non |
| Node / Edge graph | Oui | Oui Very advanced NetChart. Top pick. | Oui | - In development | Oui | Oui | ||
| Other charts | D3.js is a drawing library, and not just a chart library. You can make virtually any visualization or graph given time. | GeoChart Charts Family. And many other variations of any of ZoomCharts chart families. | Bullet, Chord, Funnel, Gauge, Grid, Maps, Pareto, Piano/Heatmap, Radar/Polar, Rankflow, Stock/OHLC, Treemap, Venn, WordCloud, Box plot, Population Pyramid, Waterfall, Calendar, Bubble Pie | Column, Funnel, Pyramid, Waterfall, Marimekko, Gauges, Gantt Charts, Heat Map, Radar, Box and Whisker, Kagi, Step Line | Geo chart, table, gauge, tree map | TreeMap, Node links | ||
| Fonctionnalités | ||||||||
| Multitouch | Oui Custom touch layer written from scratch supports up to 10 touch points. All common touch gestures can be used to control chart. | |||||||
| Possibilité de zoomer + ou - sur les graphiques | Oui | Oui Pinch gestures, swipe/mouse drag up and down, swipe/mouse drag left/right. Customizable toolbar shortcut buttons. | Oui | Oui | Oui | Non | Oui | Non |
| Annotations sur le graphique | Non | Oui Customizable | Oui | Oui | Oui | Oui new Annotation charts available in 2015 | Oui | Non |
| Combinaison de graphiques | Oui | Oui With ZoomCharts patent-pending Charts-on-Charts technology you can have any of ZoomCharts charts mixed together on one canvas. Visit demo.zoomcharts.com for examples. | Oui | Oui | Oui | Oui | Oui | Oui |
| Libellés des données | Oui | Oui | Oui | Oui | Oui | Non | Oui | Oui |
| Axe date-temps | Oui | Oui Multiple axis can be added | Oui | Oui | Oui | Oui | Oui | Non |
| Graphiques dynamiques | Oui | Oui Real time data, data aggreggation built in, incremental loading, smart cache etc | Oui | Oui | Oui | Non | Oui | Non |
| Export de fichiers | Oui | Oui png 300 dpi, jpg, pdf, excel, json | Oui | Oui | Oui | Non | Non Workaround available | Non |
| Chargement de données externes | Oui Multiple data sources supported | Oui | Oui | Oui | Non | Oui | Non | |
| Interactive (responds to mouse hover/click) | Oui | Oui Not only mouse, but full multitouch gestures support to control the chart. | Oui | Oui | Oui | Oui | Non | Non |
| Impression | Oui | Oui | Oui | Non | Non | |||
| Rotation du texte pour les libellés | Oui x-y coordinates(of text) needs to be changed after rotation of text | Oui | Oui | Oui | Oui | Non | Oui | Non |
| Plateformes | ||||||||
| Firefox | Oui | Oui | Oui | Oui | Oui | Oui | Oui | Oui 1.5+ |
| Internet Explorer | - IE 9 is supported, IE 8 is supported with Aight | Oui IE9+ | Oui 6.0+ | Oui 6.0+ | Oui | Oui | Non Partial | Oui 8.0+ |
| Google Chrome | Oui | Oui | Oui | Oui | Oui | Oui | Oui | Oui 10+ |
| Safari | Oui | Oui | Oui | Oui | Oui | Oui | Oui | Oui 3.1+ |
| Opera | Oui | Oui | Oui | Oui | Oui | Oui | Oui 9+ | |
| iPhone | Oui | Oui ZoomCharts is built primarily for mobile | Oui | Oui | Oui | Oui | Oui | Oui 1.0+ |
| iPad | Oui | Oui ZoomCharts is built primarily for mobile | Oui | Oui | Oui | Oui | Oui | |
| Android | Oui ZoomCharts is built primarily for mobile | Oui | ||||||
| Réseaux sociaux | ||||||||
| Source code repository | github.com/... | github.com/... | ||||||
| X (Twitter) | @ZoomCharts | @Highcharts | @zingchart | @FusionCharts | @jecomponents | |||
| Site web | d3js.org | zoomcharts.com | highcharts.com/... | zingchart.com | fusioncharts.com | google.com/... | github.io/... | jscharts.com |
| facebook.com/... | facebook.com/... |


 6 plus
Avis utilisateurs et commentaires
Many bugs, not reliable, and expensive. Actualy relies on Raphael ... so use Raphael direclty !
Testé avec angularjs