compare mycharts


Le gusta 0
Compare D3.js vs Highcharts vs amCharts vs DyGraph vs Morris.js
Compare D3.js vs Highcharts vs amCharts vs DyGraph vs Morris.js
Enlace | D3.js | VanCharts | Highcharts | amCharts | DyGraph | Morris.js |
|---|---|---|---|---|---|---|
| Sitio web | d3js.org | highcharts.com/... | amcharts.com | dygraphs.com | github.io/... | |
| Demo web link | github.com/... | highcharts.com/... | amcharts.com/... | github.io/... | ||
| Imagen | 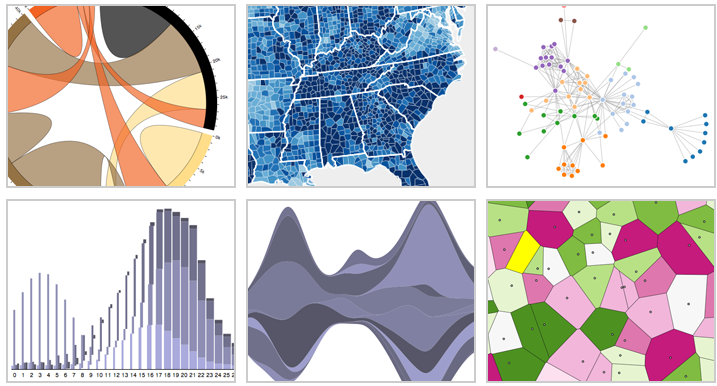 | 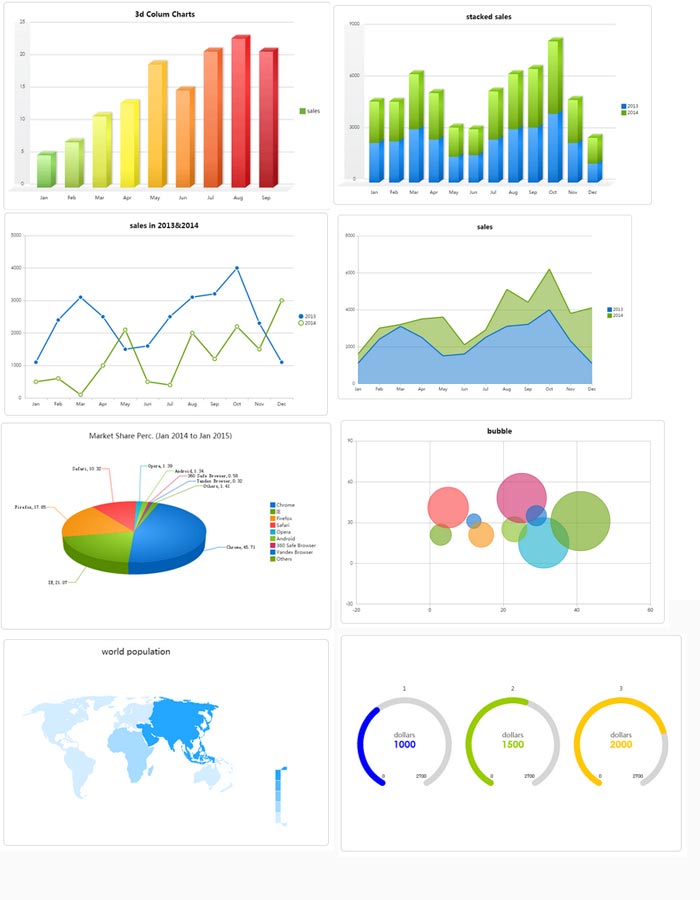 |  | 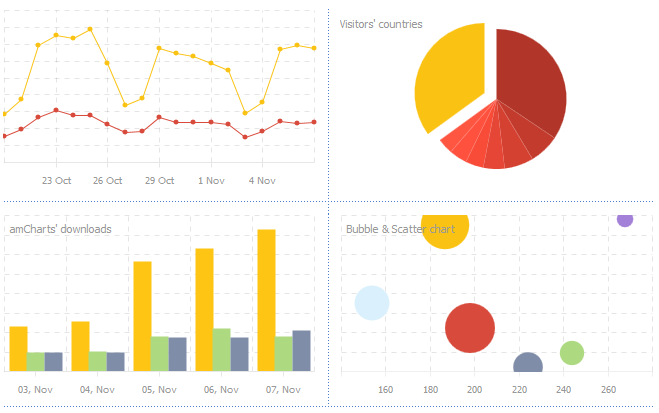 | 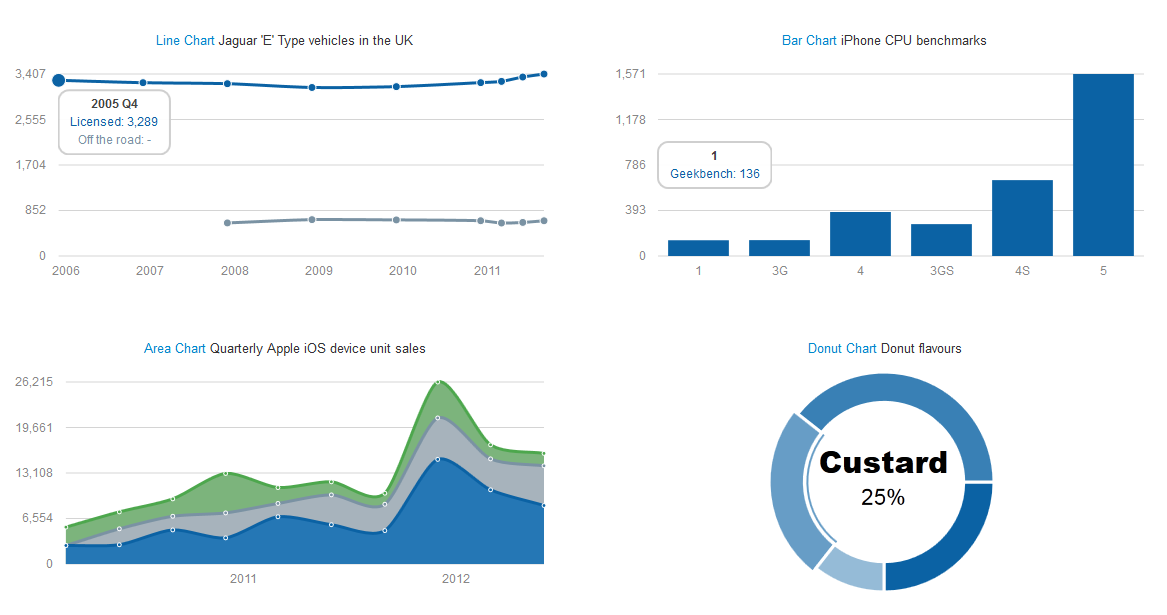 | |
| Me gusta | Le gusta 16 | Le gusta 1 | Le gusta 18 | Le gusta 3 | Le gusta 1 | Le gusta 2 |
| Open source | Sí BSD License | No | Sí CC by-nc 3.0 | No | Sí | Sí Simplified BSD |
| Latest version | 2.10.3 | version 8.1.1 | 1.0 | 3.X | 1.0.1 | 0.4.1 |
| Trial and Prices | Free under BSD | study, research or any non-profit project for free. Single developer $90. 5 Developers $200. 10 Developers $300. Unlimited $800. | Free for non commercial use and testing $ 90 (single website) - $ 3600 (10 developers license with maintenance and support for 12 months) | 1400 - Saas | MIT-Like | Free |
| Library size (compressed+gzip) | 229 KB | 41 k | 52 KB | |||
| Minified size | 116 kb | 229 KB | 45 kb | 190 KB | 133 k | 29 KB |
| Dependencies | github.com/... for partial IE8 compatibility. No dependencies needed for other browsers supported | None | None | None | excanvas if ie < 9 | jQuery, Raphaël Not exactly sexy. Needs Rapheal and annotations. No data labels, exporting and missing several chart types |
| Graphic technology | SVG | Canvas & VML | HTML5 Canvas / SVG / VML | SVG or VML for old IE | canvas | SVG |
| Charts types | ||||||
| Area | Sí | Sí | Sí | Sí | No | Sí |
| Bar | Sí | Sí | Sí horizontal, vertical | Sí | No | Sí vertical only |
| Bubble | Sí | Sí | Sí | Sí | No | No |
| Line | Sí | Sí | Sí | Sí | Sí | Sí |
| Pie | Sí | Sí | Sí | Sí | No | No |
| Scatter | Sí | Sí | Sí | Sí | No | No |
| Spline | Sí | Sí | Sí | Sí | No | Sí |
| Sparklines | Sí | No | Sí | Sí | No | No |
| Candlestick | - Unofficial example: https://gist.github.com/1074045 | Sí | Sí Highstock, separate product | Sí | No | No |
| Donut | Sí | Sí | Sí | Sí | No | Sí |
| Node / Edge graph | Sí | No | Sí | No | No | No |
| Other charts | D3.js is a drawing library, and not just a chart library. You can make virtually any visualization or graph given time. | map, GIS map, Gantt chart,Column Chart,Gauge Chart,Radar Chart,Custom Chart,range chart``` | Gauges, Radar, Polar, Step line, Step without Risers, OHLC, area range, Donut, Funnel, Waterfall, Bullet, XY, Maps are available as additional package | |||
| Características | ||||||
| Multitouch | ||||||
| Ability to zoom in and out of charts | Sí | Sí | Sí | Sí | Sí | No |
| Annotations on the chart | No | Sí | Sí | Sí | No | No |
| Combination of charts | Sí | Sí | Sí | Sí | No | No |
| Data labels | Sí | Sí | Sí | Sí | No | |
| Date-time axis | Sí | Sí | Sí | Sí | Sí | Sí |
| Dynamic charts | Sí | Sí | Sí | Sí | No | |
| Export files | Sí | Sí PNG, PDF, EXCEL | Sí | Sí PNG, JPG, SVG, PDF | No | |
| External Data Loading | Sí | Sí | Sí | No | ||
| Interactive (responds to mouse hover/click) | Sí | Sí | Sí | Sí | Sí | Sí |
| Sí | Sí | Sí | No | |||
| Text Rotation for Labels | Sí x-y coordinates(of text) needs to be changed after rotation of text | Sí | Sí | Sí | No | |
| Platforms | ||||||
| Firefox | Sí | Sí | Sí | Sí | Sí | Sí |
| Internet Explorer | - IE 9 is supported, IE 8 is supported with Aight | Sí IE6+ | Sí 6.0+ | Sí 6.0+ | Sí IE < 9 with Google's excanvas | Sí 6.0+ |
| Google Chrome | Sí | Sí | Sí | Sí | Sí | Sí |
| Safari | Sí | Sí | Sí | Sí | Sí | |
| Opera | Sí | Sí | Sí | Sí | Sí | |
| iPhone | Sí | Sí | Sí | Sí | Sí | |
| iPad | Sí | Sí | Sí | Sí | Sí | |
| Social Networks | ||||||
| Source code repository | github.com/... | github.com/... | github.com/... | |||
| X (Twitter) | @Highcharts | @amcharts | @olly_smith | |||
| Sitio web | d3js.org | highcharts.com/... | amcharts.com | dygraphs.com | github.io/... |


 3 more
User reviews and comments