Morris.js

Le gusta 2

Name | Morris.js |
|---|---|
| Open source | Sí Simplified BSD |
| Trial and Prices | Free |
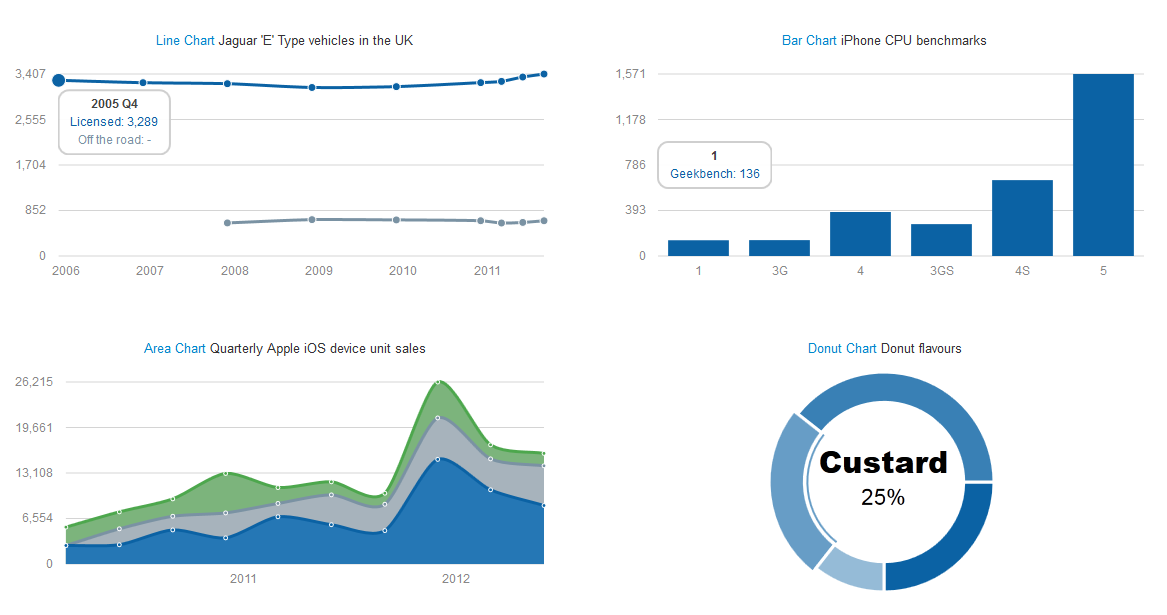
| Dependencies | jQuery, Raphaël Not exactly sexy. Needs Rapheal and annotations. No data labels, exporting and missing several chart types |
| Graphic technology | SVG |
| Bar | Sí vertical only |
| Pie | No |
| Donut | Sí |
| Internet Explorer | Sí 6.0+ |
| Annotations on the chart | No |
| Interactive charts | Sí |
| Clickable points | |
| Sitio web | github.io/... |
| Demo web link | github.io/... |
| Latest version | 0.4.1 |
| Library size (compressed+gzip) | 52 KB |
| Minified size | 29 KB |
| Area | Sí |
| Areaspline | Sí |
| Dot | No |
| Line | Sí |
| Scatter | No |
| Spline | Sí |
| Sparklines | No |
| Candlestick | No |
| Node / Edge graph | No |
| Other charts | |
| Ability to zoom in and out of charts | No |
| Combination of charts | No |
| Date-time axis | Sí |
| Dynamic charts | No |
| Export files | No |
| External Data Loading | No |
| Highlights region | |
| Data labels | No |
| Text Rotation for Labels | No |
| No | |
| Tooltips about data points | Sí |
| Google Maps Support | No |
| Firefox | Sí |
| Google Chrome | Sí |
| Safari | Sí |
| Opera | Sí |
| iPhone | Sí |
| iPad | Sí |
| Source code repository | github.com/... |
| X (Twitter) | @olly_smith |
| Sitio web | github.io/... |




User reviews and comments
Works well for what I needed.