VanCharts

J'aime 1
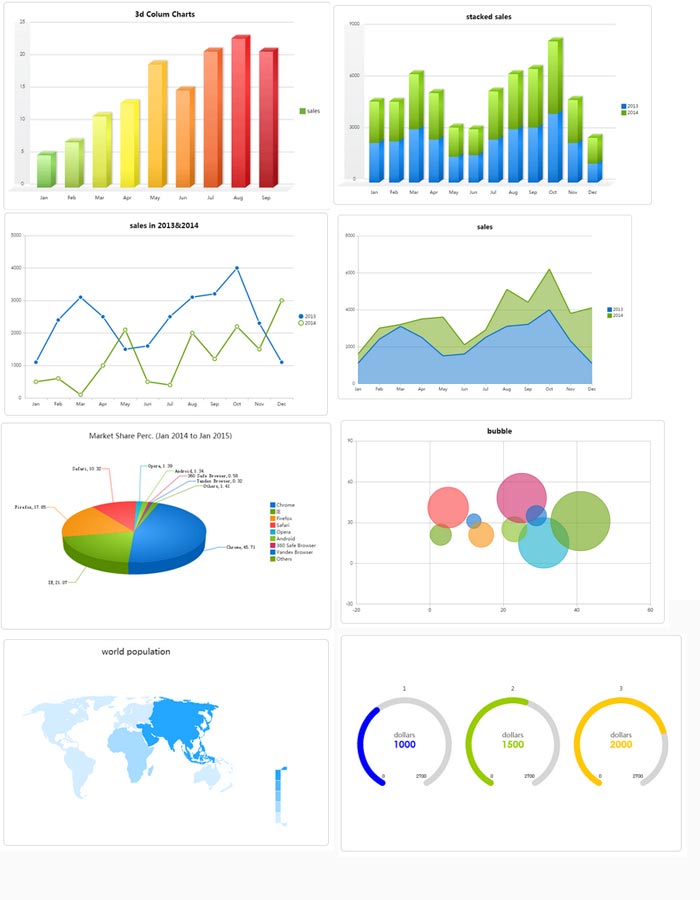
VanCharts was a JavaScript library to build graph and charts. To
find an alternative you can have a look at the following
comparison:
javascript-graphs-and-charts-libraries
VanCharts was a JavaScript library to build graph and charts. To
find an alternative you can have a look at the following
comparison:
javascript-graphs-and-charts-libraries
Nom | VanCharts |
|---|---|
| Site web | |
| Lien de démonstration | |
| Open source | Non |
| Dernière version | version 8.1.1 |
| Gamme de prix | study, research or any non-profit project for free. Single developer $90. 5 Developers $200. 10 Developers $300. Unlimited $800. |
| Taille minifié | 229 KB |
| Dépendances | None |
| Graphic technology | Canvas & VML |
| Types de Graphiques | |
| Area | Oui |
| Bar | Oui |
| Bubble | Oui |
| Line | Oui |
| Pie | Oui |
| Scatter | Oui |
| Spline | Oui |
| Sparklines | Non |
| Candlestick | Oui |
| Donut | Oui |
| Node / Edge graph | Non |
| Other charts | map, GIS map, Gantt chart,Column Chart,Gauge Chart,Radar Chart,Custom Chart,range chart``` |
| Fonctionnalités | |
| Events | |
| Multitouch | |
| Possibilité de zoomer + ou - sur les graphiques | Oui |
| Annotations sur le graphique | Oui |
| Combinaison de graphiques | Oui |
| Libellés des données | Oui |
| Axe date-temps | Oui |
| Graphiques dynamiques | Oui |
| Export de fichiers | Oui PNG, PDF, EXCEL |
| Chargement de données externes | Oui |
| Interactive (responds to mouse hover/click) | Oui |
| Impression | Oui |
| Rotation du texte pour les libellés | Oui |
| Plateformes | |
| Firefox | Oui |
| Internet Explorer | Oui IE6+ |
| Google Chrome | Oui |
| Safari | Oui |
| Opera | Oui |
| iPhone | Oui |
| iPad | Oui |
| Réseaux sociaux | |
| Source code repository | |
| X (Twitter) | |
| Site web |


Avis utilisateurs et commentaires
A good JS chart library!