| Other charts | Bullet, Chord, Funnel, Gauge, Grid, Maps, Pareto, Piano/Heatmap,
Radar/Polar, Rankflow, Stock/OHLC, Treemap, Venn, WordCloud, Box
plot, Population Pyramid, Waterfall, Calendar, Bubble Pie | Gauges, Radar, Polar, Stepline, Step, OHLC, Range Area, Range Bar,
Funnel, Pyramid, Maps, Gantt, Stock, Bullet, Box, Error, Radar,
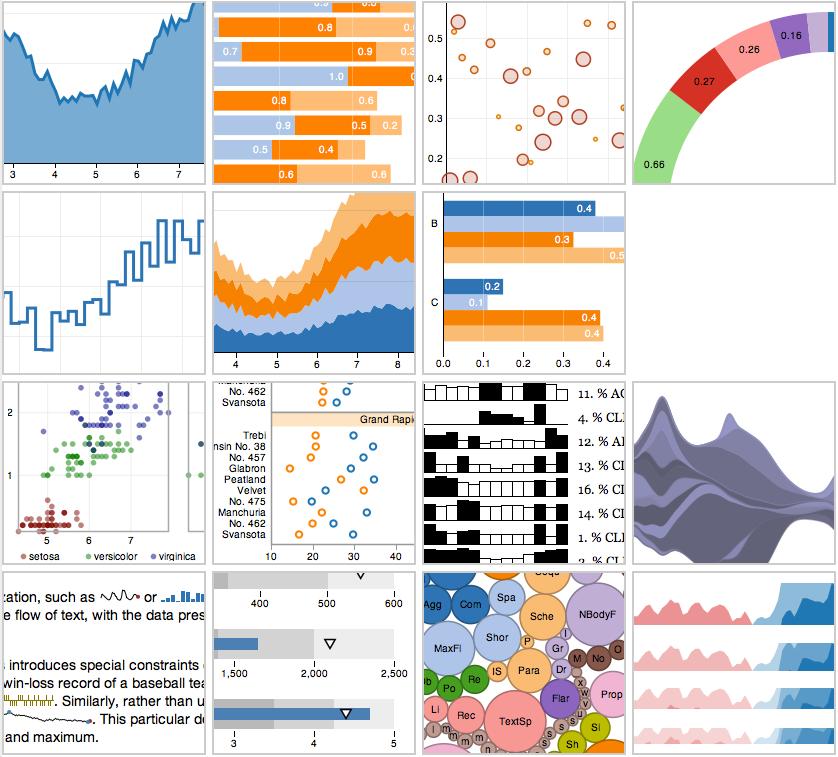
Polar, and more | | D3.js is a drawing library, and not just a chart library. You can
make virtually any visualization or graph given time. | Radar, Combination, From-To, Target vs Actual, History, Scroll,
Real-time, Broken-axis, Matrix, Image, Wing, Gauge | Range Bar/Area/SplineArea, Polar Bar/Area/Spline/Scatter, Stepline,
Steparea | histograms, box plots, time series, subplots, polar charts,
multiple axes, insets, log plots, maps, contour plots, 2D
histograms, error bars, 3D surface plots, 3D scatter plots, 3D line
plots | Column, Funnel, Pyramid, Waterfall, Marimekko, Gauges, Gantt
Charts, Heat Map, Radar, Box and Whisker, Kagi, Step Line | Bipolar, Bar, Donut, Fuel, Funnel, Gantt, Gauge, Horizontal Bar,
Horizontal Progress bar, Line, Marimekko, Meter, Pie, Radar, Rose,
Scatter, Thermometer, VerticalLine chart, Vertical Progress bar,
Waterfall, XY Plots, everything AJAX dynamic, Google Sheets support | Linear Gauge, Radial Gauge, Bubble, Bullet, Donut, Scatter, Stock | Spline, Step Line, OHLC, Scatter, Funnel, Pyramid, Step Area,
Stacked Area, Stacked Area 100%, Range Area, Range Spline Area,
Stacked Column, Stacked Column 100%, Range Column, Stacked Bar,
Stacked Bar 100%, Range Bar | calendar heatmap, treemap, radar | Gauges, Radar, Polar, Step line, Step without Risers, OHLC, area
range, Donut, Funnel, Waterfall, Bullet, XY, Maps are available as
additional package | Geo chart, table, gauge, tree map | | Horizbar, SmoothLine, Donut, HorizArea, Bubble, Candle (OHLC) | TreeMap, Node links | | | Donut3D - Bar Chart - Ray Chart - Stock Chart | | | Bubble, Candlestick (OHLC), Spider. Other Dojo modules provide as
well TreeMap, Gauges etc... | | Bubble, radar, polar | Bubble, radar |
|---|


User reviews and comments

Ajay_LCJS on Aug. 16th 2021 6:39:44 AM 
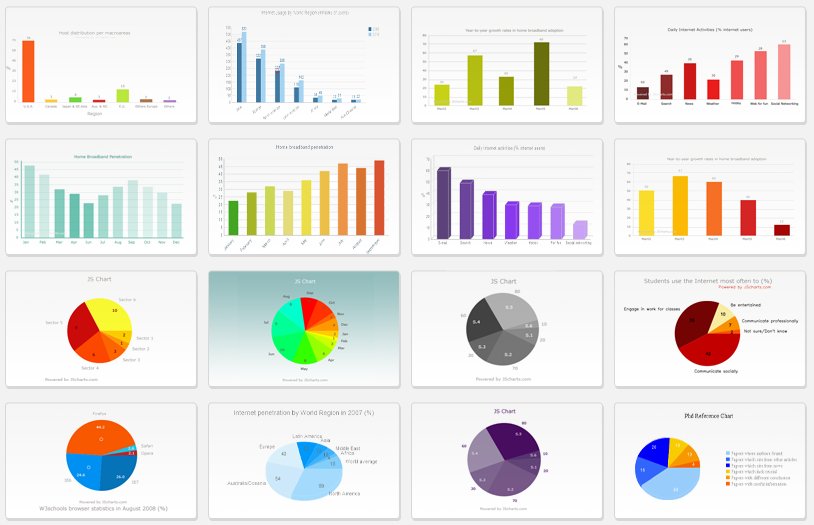
phlox3 on Mar. 18th 2018 6:36:28 PM commented on FusionCharts 
mbenitez01 on Sep. 29th 2017 1:06:31 PM 
Air Serenity on Aug. 25th 2016 10:26:17 AM 
Ibrahim Dauda on Jul. 28th 2016 12:03:15 PM 
Stef'nPIJs on May 3rd 2016 2:48:59 PM rated ZingChart: Integ. FrameWork client (JS) 5/5 
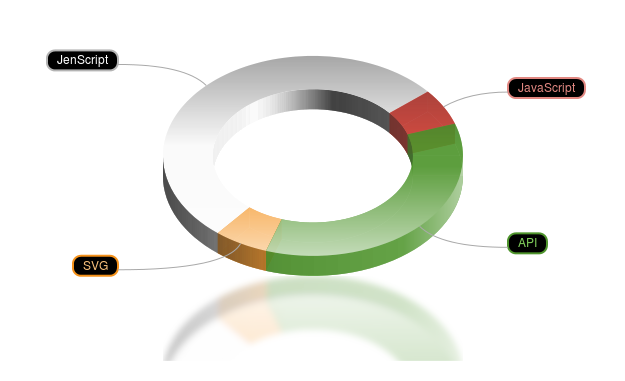
sebastien on Oct. 9th 2015 4:14:36 PM suggested on JenScriptJS to set Name to JenScriptJS 
Sacred on May 20th 2015 7:00:08 AM 
Sacred on May 20th 2015 6:44:15 AM 
palesilent on Apr. 29th 2015 5:23:45 AM 
Anv on Mar. 9th 2015 6:20:23 PM 
Maximilian Q. Wang on Feb. 18th 2015 6:20:56 PM suggested on ZingChart to set Name to ZingChart 
Leonidas Euripide Savvides on Jan. 8th 2015 8:59:09 AM 
Meera Srinivasan on Dec. 29th 2014 2:18:14 PM 
Ken on Nov. 25th 2014 7:32:05 PM 
Hola on Nov. 3rd 2014 6:37:16 AM 
Serge Ryadkow on May 7th 2014 4:10:05 PM 
MungMoon on Sep. 3rd 2013 9:34:17 AM 
Vladimir Georgiev on Aug. 3rd 2013 2:53:35 PM 
Richard Lynch on Jul. 3rd 2013 8:15:32 PM
see older commentsThanks for this great list! I think you should also add LightningChartJS to that list LightningChart JS lightningchart.com LightningChart JS is a WebGL-based, cross-platform charting library that has been developed for delivering an outstanding performance. Performance is up to 10M+ of data points in real-time.In recent line chart comparison tests, none of the competitors got even close to LightningChart performance level. In Dashboard cell resizing LC is an industry superlative: Rendering dozens or even 100+ charts simultaneously. LightningChart JS comes with an unmatched execution performance. GPU acceleration & WebGL rendering ensure that your device’s graphics processor is utilized efficiently, which results in high refresh rates and smooth animations. This charting library combines incredible speed with sturdy load capacity.
Many bugs, not reliable, and expensive. Actualy relies on Raphael ... so use Raphael direclty !
Can't believe you left out 'chartist' !! this 11k package is awesome, specially for embed into the iot universe (in which I develop) github.io/...
Thanks, very useful! Still, one criteria is missing: the ability to UPDATE a graph smoothly instead of redrawing it completly (when data change, for minute-updated data, etc.) Among free tools, I only found Google Charts able to do it (because it uses a class to host data -and not pure JSON table- and a class to draw graphs, and they are tightly linked)
Nice work here! Also add jchartfx to the list.
Testé avec angularjs
JavaScript Charts Library SVG
Reverted those manually.
I've done some terrible things (removing some libraries from comparison table) thinking that my modifications are only affecting my own dashboard. Now i can't find the option to revert my changes. Can anyone help me?
I would vote for VanCharts. But it's not in the list. Home:vancharts.com/... Introduction:vancharts.com/...
Also try PlusCharts ( www.pluscharts.com ) which is a free light-weight Javascript Charting library. It is based on the popular RaphaelJS library.
is any chart lib work offline - after downloaded? eg in an offline mobile web/hybrid app?
Hi, can you elaborate on data base compatibility. For e.g. can any or all of these pick data from mysql. Are these php scripts
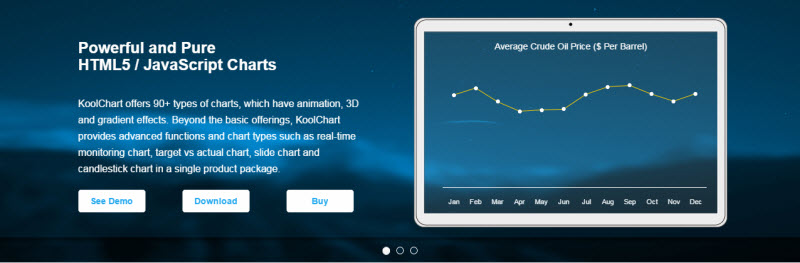
I would like to vote for KoolChart, www.koolchart.com , but it's not in the list
I use FusionCharts and D3. Never needed any other library for my requirements.
Look jsgadget.ru/... but the site is in Russian
Thanks for your article. I recommand another chart. that's the KoolChart. You can view demos of this chart in www.koolchart.com. I votes for KoolChart.
Shield UI is a powerful and feature-rich JavaScript library. It also provides server-side components for ASP.NET, ASP.NET MVC and Java Apache Wicket. Check the demos at: shieldui.com Company website: shieldui.com
We are specifically looking for solutions for tablets that don't support Flash. Any insights regarding A vs B for tablets specifically would be most welcome. rlynch AT zacks DOT com