Compare Sizes
Register
Français Español

Data visualization libraries Matrix

3

Compare libraries to simplify data visualisation: amCharts vs arcadiaCharts vs AwesomeChartJS vs CanvasJS Charts vs canvasxpress vs D3.js vs dhtmlxChart vs Dojo vs Dygraphs vs Ejschart vs Elycharts vs Flotvs FusionCharts...

Link
FusionChartsFlotjqPlotMorris.jsZingChartflotr2Elychartsnvd3Dracula Graph LibraryMilkChartjsPlumbDygraphsgRaphaëlcanvasxpressJSXGraphdhtmlxChartCanvasJS ChartsAwesomeChartJSDojo (dojox/charting)D3.jsHighchartsProtovisJavaScript InfoVis ToolkitRickshawShield UI ChartsarcadiaChartsWijmoRGraphamChartsKendoUI DataVizjqChartGoogle Chart ToolsEjschartTeeChartSencha Touch ChartsJSChartsyFiles for HTMLJSCharting
Image
Open sourceNoYes MIT LicenseYes MIT, GPL v2Yes Simplified BSDNoYes MIT LicenseYes MIT LicenseYes Apache 2.0Yes MIT LicenseYes MIT LicenseYes MIT, GPL v2Yes MIT licenseYes MIT LicenseYes LGPL3Yes LGPLYes GNU GPLYes CC nc 3.0Yes Apache License v2.0Yes BSD, AFLv2Yes BSD LicenseYes CC by-nc 3.0Yes BSD LicenseYesYesNoNoNoYes Open Source (GPL) + commercialNoNoNoNoNoYesNoNoNoNo
Trial and Prices999FreeFreeFreeFull library free to use with small link. Licenses start at $199. SaaS and OEM available.FreeFreeFree depending on Apache 2.0FreeFreeFreeFreeFree (you can donate)FreeFreeFree under GNU GPL, $49999 - SaasFree depending on Apache 2.0FreeFree under BSDFree for non commercial use and testing $ 90 (single website) - $ 3600 (10 developers license with maintenance and support for 12 months)FreeFree (you can donate)Free of charge with copyright attributionFree for Non-commercial use. Requires license for commercial. OEM licensing available.Must link back to site. No license availableFree for non commercial use.
$100 / $250 / $1000
Free (GPL) and commercial1400 - Saas$ 399$299Free$1000Free - MIT licenseFree under GPLv3 license; $999 commercial license$ 39 - $ 149
Free with watermark
Free trial with watermark. Requires license for commercial use. Royalty free Licenses.Free with small link. Paid licenses for non-branded usage.
DependenciesNonejQuery Comes with unicorn, capable and robust, simplejQuery Looks as good as Flot (somewhat better), not much support, pluggable but no plugins. Too young.jQuery, Raphaël Not exactly sexy. Needs Rapheal and annotations. No data labels, exporting and missing several chart typesNoneunderscore.js, beam.js No donut chart. Buzzzz. But seems very capable.jQuery,Raphaël Charts seem kind of dinky. REasonable alternative.d3.js and Aight for IE8 support - VERY cool but based on D3, no IE8 and prior.RaphaëljQuery or MooTools or YUI3RaphaëlNoneNone outside of the Dojo Toolkit - VERY nice but heavy for our needsgithub.com/... for partial IE8 compatibility. No dependencies needed for other browsers supportedNoned3.jsjQuerynoneNonejQuery 1.9+NoneNonenone
Graphic technologySVG / VMLCanvasCanvasSVGHTML5 Canvas / SVG / VMLCanvasSVGSVGSVGCanvasCanvas / SVG / VMLCanvasSVGCanvasSVGCanvasHTML5 CanvasCanvasSVG, Canvas if not available VML or SilverlightSVGHTML5 Canvas / SVG / VMLSVGCanvasSVGSVG, VMLCanvasSVGCanvas and SVGSVG or VML for old IESVGCanvasSVGCanvas / SVG / VMLCanvasCanvasCanvasSVG+CSS, Canvas, HTMLSVG
BarYesYesYesYes vertical onlyYesYesYes vertical onlyYesYes custom plotterYes (8 Kb) vertical onlyYesYesYes bar and xbarYesYesYesYes horizontal, verticalYesYesYes vertical onlyYesYesYesYesYesYesYesYesYesYesYes vertical onlyNoYes
PieYesYesYesNoYesYesYesYesNoYes (4 Kb)YesYesYes pie, pie 3d, and donutYesYesYesYesYesYesNoYesYesYesYesYesYesYesYesYesYesYesNoYes
DonutYesYesYesYesYesNoYesYesNoNoNoYesYesNoYesYesYesNoNoYesYesYesYesYesNoYesYesYesNoNoNoYes
Internet ExplorerYesYes 6.0+Yes 7+Yes 6.0+Yes 6.0+Yes 6.0+Yes 6.0+- IE 9, IE8 requires AightYes 6.0+Yes 9.0+Yes 6.0+- 9.0+ / OR / ie6+ ExplorerCanvas or FlashCanvasYes 6.0+YesYes IE8+Yes 6+- IE 9 is supported, IE 8 is supported with AightYes 6.0+No PartialYes 7.0+- IE 9, IE8 requires AightYes 5.0+YesYes 6.0+YesYes 6.0+Yes 7+Yes 6.0+YesYes 6.0+Yes 9.0+Yes 8.0+Yes IE9+Yes IE9+
Annotations on the chartYesYesYesNoYesYesNoYesYesNoYesYes IndexlabelsNoNoYesYesYesYesYesYesYesYes new Annotation charts available in 2015YesYesNoYesYes
Interactive chartsYesYesYesYesYesYesYesYesYesYesYesYesYesYes mouse & touch (mobile) interactionYesYesYesYesYesYesYesYesYesYesNoYesYes
Clickable pointsYesYesYesYesYesYesYesNoNoYesYesYesYesYesYesYesYesYesYesYesYesNoYesYes
Websitefusioncharts.comflotcharts.orgjqplot.comgithub.io/...zingchart.comhumblesoftware.com/...elycharts.comgithub.com/...graphdracula.netmootools.net/...jsplumbtoolkit.comdygraphs.comraphaeljs.comcanvasxpress.orguni-bayreuth.de/wp/dhtmlx.com/...canvasjs.comgithub.com/...dojotoolkit.org/...d3js.orghighcharts.com/...github.io/...thejit.orgshutterstock.com/...shieldui.comwijmo.comrgraph.netamcharts.comtelerik.com/...jqchart.comgoogle.com/...ejschart.comgithub.com/...sencha.com/...jscharts.comyworks.com/...jscharting.com
Demo web linkfusioncharts.com/...flotcharts.org/...jqplot.com/...github.io/...zingchart.com/...humblesoftware.com/...elycharts.com/...brettdixon.com/...jsplumbtoolkit.com/...dygraphs.com/...raphaeljs.comuni-bayreuth.de/...dhtmlx.com/...canvasjs.com/...dojotoolkit.org/...github.com/...highcharts.com/...github.io/...github.com/...shutterstock.com/...shieldui.comrgraph.net/...amcharts.com/...kendoui.com/...jqchart.com/...google.com/...ejschart.com/...steema.com/...sencha.com/...jscharts.com/...yworks.com/...jscharting.com/...
Latest version3.40.8.1 (may 2013)1.0.0b2_r10120.4.12.5.1 (2016)2.1.4-Snapshot (Aug, 2011)0.0.31.5.81.3.160.5.00.998.0.23.7.10If you are interested in a far more advanced, interactive JavaScript plotting library, take a look at Flot.1.102.10.31.03.3.12.0.120121.7.11.0.26.17 (March 2024)3.XQ1 20132.320183.01.3.0.42.8
Library size (compressed+gzip)553 KB238 KB1.1 MB52 KB223 KB32 kb50 KB88.5 KB35 KB27 KB500 KB (can easily be scaled down if you just use a subset of chart types)32 KB3.11 Mb24 KB (only through google link, no offline mode)1.5 MB373 KB
Minified size553 KB95 KB161 KB29 KB96 KB65 KB153 KB110 KB28.5 KB519.2 KB54 KB170 KB (can easily be scaled down if you just use a subset of chart types)116 kb45 kb4.7 MB159 KB200 K374 k190 KB6.5 MB373 KB
AreaYesYesYesYesYesYes Line charts can also have fillsYesYesYes Line charts can also have fillsYes Line charts can also have fillsYesNoYesYesYesYesYesYesYesYesYesNoYesYesYesYesYesYesYesYesNoNoYes
AreasplineYesYesYesYesYesNoYesYesNoNoYesNoNoYesYesYesYesYesYesYesNo- In progress for next revisionYesYesNoNoYes
DotYesYesYesNoYesNoYesYes- custom plotterYes (2.5 Kb)YesNoNoYesYesYesNoYesYesYesYesNoNoYesYesNoNoNoYes
LineYesYesYesYesYesYesYesYesYesYes (4 Kb)YesYesYesYesYesYesYesYesYesYesYesYesYesYesYesYesYesYesYesYesYesNoYes
ScatterYesYesYesNoYesYesNoYesNoNoYesNoYesYesYesYesYesYesYesYesYesYesYesYesYesYesYesYesNoNoYes
SplineYesYesYesYesYesNoYesYesNoNoYesYes only line, not areaYes spline and spline areaYesYesYesYesYesYesYes by defaultYesNoYesYesNoYesNo- In progress for next revisionYesYesNoNoYes
SparklinesYesYes based on the line chartNoYesYesNoNoYesYesYesYesYesYesYesYesYesNo- In progress for next revisionNoNoYes
CandlestickYesYes plugin: http://jumflot.jumware.com/candlestick.htmlYesNoYesYesNoNoYes custom plotterNoYesNoNoYesYes- Unofficial example: https://gist.github.com/1074045Yes Highstock, separate productYesNoNoYesYesYesYesYesYesYesNoNoNoYes
Node / Edge graphYesNo- In developmentNoYesYesYesYesYesYesNoYesYes
Other chartsColumn, Funnel, Pyramid, Waterfall, Marimekko, Gauges, Gantt Charts, Heat Map, Radar, Box and Whisker, Kagi, Step LineBubbles, Gantt, Pyramid, SpiderBullet, Chord, Funnel, Gauge, Grid, Maps, Pareto, Piano/Heatmap, Radar/Polar, Rankflow, Stock/OHLC, Treemap, Venn, WordCloud, Box plot, Population Pyramid, Waterfall, Calendar, Bubble PieBubble, radarFunnelBullet chartVenn diagram, Genome Browser, Heatmap, Correlation plot, Network and pathwayMath...calendar heatmap, treemap, radarSpline, Step Line, OHLC, Scatter, Funnel, Pyramid, Step Area, Stacked Area, Stacked Area 100%, Range Area, Range Spline Area, Stacked Column, Stacked Column 100%, Range Column, Stacked Bar, Stacked Bar 100%, Range BarBubble, Candlestick (OHLC), Spider. Other Dojo modules provide as well TreeMap, Gauges etc...D3.js is a drawing library, and not just a chart library. You can make virtually any visualization or graph given time.TreeMap, Node linksTreeMap, SpaceTree, RGraph, HyperTree, RGraph, Icicle, Sunburst, ForceDirectedRange Bar/Area/SplineArea, Polar Bar/Area/Spline/Scatter, Stepline, StepareaBipolar, Bar, Donut, Fuel, Funnel, Gantt, Gauge, Horizontal Bar, Horizontal Progress bar, Line, Marimekko, Meter, Pie, Radar, Rose, Scatter, Thermometer, VerticalLine chart, Vertical Progress bar, Waterfall, XY Plots, everything AJAX dynamic, Google Sheets supportGauges, Radar, Polar, Step line, Step without Risers, OHLC, area range, Donut, Funnel, Waterfall, Bullet, XY, Maps are available as additional packageLinear Gauge, Radial Gauge, Bubble, Bullet, Donut, Scatter, StockBubble, radar, polarGeo chart, table, gauge, tree mapf(x), Gauge, Donut, alarm, candle stick, step series, over under, 
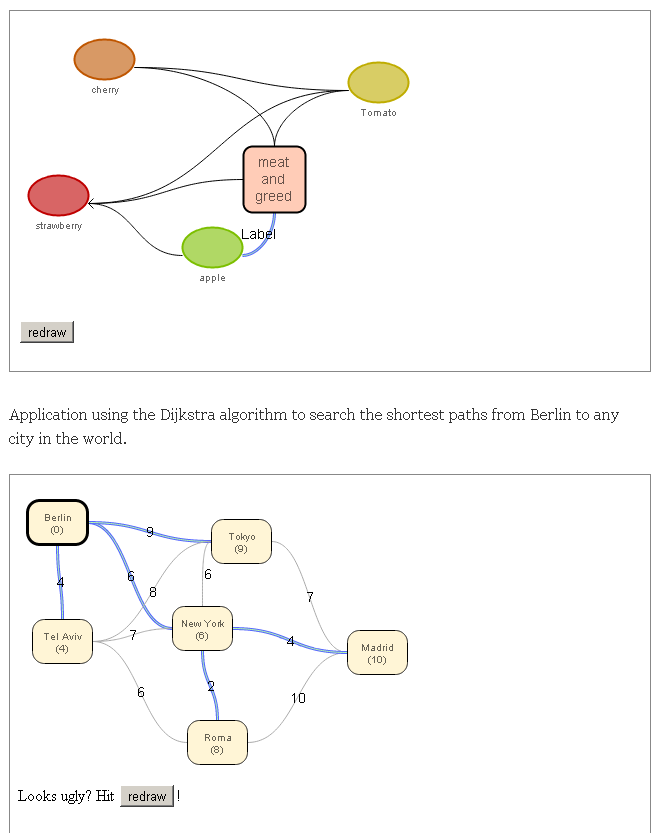
open high low, error series, stacked bar, trend, and floating barHorizbar, SmoothLine, Donut, HorizArea, Bubble, Candle (OHLC)While focussed on Node / Edge Graphs, at its core it *can* be used as a visualization library that can visualize almost anything.
Ability to zoom in and out of chartsYesYesYesNoYesYesNoYesYesNoYesYesNoYesYesYesYesYesYesYesYesYesYesYesNoYesYesNoYesYes
Combination of chartsYesYesYesNoYesYesNoYesNoNoYesYesYesYesYesYesYesYesYesYesYesYesYesYesYesYesYesYesYesYes
Date-time axisYesYesYesYesYesNoYesNoYesYesYes- Feasible with custom codeYesYesYesYesYesYesYesYesYesYesYesNoNoYes
Dynamic chartsYesYesYesNoYesYesYesYesNoNoYesYesYesYesYesYesYesYesYesYesYesYesYesYesNoYesYesNoYes Dynamic Node/Edge Graphs
Export filesYesNoYesNoYesYes PNG, JPGNoNoNoYes export to PDF/PNGYesYes SVGYesYesNo Workaround availableYesYesYes PNG, JPG, SVG, PDFYesYesNo-YesNoYesYes PNG, PDF, JPG, SVG
External Data LoadingYesYes- possible with jQueryNoYesNoNoYesNoYesYesYes Using dojo/storeYesYesYesYesYesYesNoYesYesNoYesYes
Highlights regionYesYesYesYesYesNoNoNoYesYesNoYesYesYesYesYesNoYesYes
Data labelsYesYesYesNoYesYesYesYesYesYesYesYes- Only on a subet of charts, improvement planned for future versionsYesYesYesYesYesYesYesYesYesNoYesYesYesYesYes
Text Rotation for LabelsYesNoYesYesYesNoNoNoYes With CSSYesYesYes x-y coordinates(of text) needs to be changed after rotation of textYesYesYesYesYesYesYesNoYesYesNoYesYes
PrintYesNoNoYesNoYesNoNoYesYesYesYesYesYesYesYesNoYesNoYesYes
Tooltips about data pointsYesYesYesYesYesYesYesYesNoYesYesYesYesYesYesYesYesYesYesYesYesYesYesYesYesNoYesYes
Google Maps SupportNoNoNoNoYesNoNoNoNoNo-
FirefoxYesYesYesYesYesYesYes 3.0+YesYesYesYes 3.0+Yes 2.0+YesYesYes 3.6+YesYesYesYesYesYesYesYes 3.0+YesYesYesYesYesYes 1.5+YesYes 1.5+YesYes
Google ChromeYesYesYesYesYesYes 5.0+YesYesYesYes 5.0+YesYesYesYesYesYesYesYesYesYesYesYesYesYesYesYesYesYesYesYesYes 10+YesYes
SafariYesYesYesYesYesYesYes 3.0+YesYesYes 3.0+Yes 3.0+YesYesYesYesYesYesYesYesYesYes 3.0+YesYesYesYesYesYes 3.1 (2.0 on MAC)YesYes 3.1+YesYes
OperaYesYesYesYesYesYes 9.5+YesYes 9.5+YesYesYes- Might work but not officially supportedYesYesYesYesYesYesYesYesYesYesYes 9+YesYes 9+YesYes
iPhoneYesYesYesYesYesYesYesYesYesYesYesYesYesYesYesYesYesYesYesYesYesYes 1+YesYesYes 1.0+YesYes
iPadYesYesYesYesYesYesYesYesYesYesYesYesYesYesYesYesYesYesYesYesYesYesYesYesYesYes
Source code repositorygithub.com/...bitbucket.org/...github.com/...github.com/...github.com/...github.com/...github.com/...github.com/...github.com/...github.com/...github.com/...github.com/...
Twitter
Websitefusioncharts.comflotcharts.orgjqplot.comgithub.io/...zingchart.comhumblesoftware.com/...elycharts.comgithub.com/...graphdracula.netmootools.net/...jsplumbtoolkit.comdygraphs.comraphaeljs.comcanvasxpress.orguni-bayreuth.de/wp/dhtmlx.com/...canvasjs.comgithub.com/...dojotoolkit.org/...d3js.orghighcharts.com/...github.io/...thejit.orgshutterstock.com/...shieldui.comwijmo.comrgraph.netamcharts.comtelerik.com/...jqchart.comgoogle.com/...ejschart.comgithub.com/...sencha.com/...jscharts.comyworks.com/...jscharting.com
Embed
Compare libraries to simplify data visualisation: amCharts vs arcadiaCharts vs AwesomeChartJS vs CanvasJS Charts vs canvasxpress vs D3.js vs dhtmlxChart vs Dojo vs Dygraphs vs Ejschart vs Elycharts vs Flotvs FusionCharts...
IT development
English
Public
Public
Apr. 5th 2024 4:38:14 AM
22 more
View changes
Manage backups

User reviews and comments

  • phlox3 on Mar. 18th 2018 6:36:28 PM
    commented on FusionCharts

    Many bugs, not reliable, and expensive. Actualy relies on Raphael ... so use Raphael direclty !

  • Lakshmanan M on Jun. 27th 2016 6:24:17 PM
    commented on Elycharts

    What does external data loading mean? Does it not support dynamical json data from server.?

  • Stef'nPIJs on May 3rd 2016 2:48:59 PM

    Testé avec angularjs

  • Maximilian Q. Wang on Feb. 18th 2015 6:20:56 PM
    suggested on ZingChart to set Name to ZingChart
  • Andrei Bulanau on Jul. 17th 2012 6:54:43 PM
    commented on gRaphaël

    Raphaël currently supports Firefox 3.0+, Safari 3.0+, Chrome 5.0+, Opera 9.5+ and Internet Explorer 6.0+.